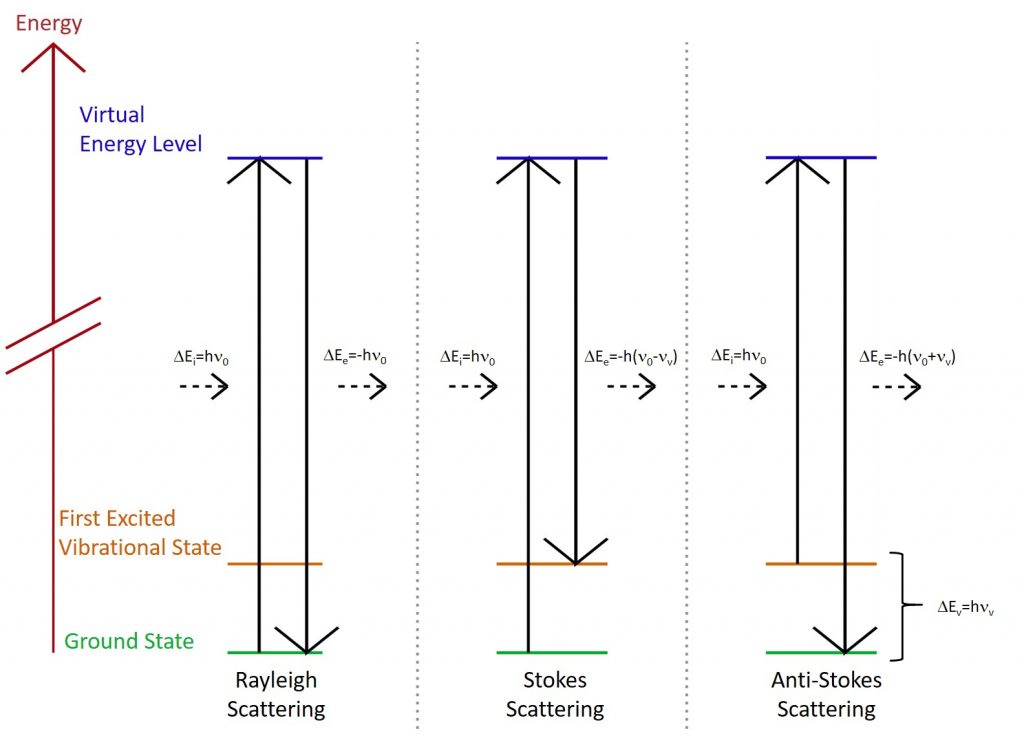
1. Origins of Raman
2. Instrumentation
3. Ways to improve Raman signal intensity
3.1. Stimulated Raman
3.2. CARS
3.3. Resonance Raman (RR)
3.4. SERS and SERRS
Recommended Products
1. Origins of Raman
The Raman effect is based on molecular deformations in electric field E determined by molecular polarisability a. The laser beam can be considered an oscillating electromagnetic wave with electrical vector E. Upon interaction with the sample, it induces electric dipole moment P = a E, which deforms molecules. Periodical deformation molecules begin vibrating with characteristic frequency um. The amplitude of vibration is known as nuclear displacement. In other words, monochromatic laser light with frequency u0 excites molecules and transforms them into oscillating dipoles. Such oscillating dipoles emit light of the following three frequencies (Fig.1):
-
Elastic Rayleigh scattering: A molecule with no Raman-active modes absorbs a photon with the frequency u0. The excited molecule returns back to the same basic vibrational state and emits light with the same frequency u0 as an excitation source.
-
Stokes frequency: A photon with frequency u0 is absorbed by a Raman-active molecule which at the time of interaction is in the basic vibrational state. Part of the photon's energy is transferred to the Raman-active mode with frequency um and the resulting frequency of scattered light is reduced to u0 - um.
-
Anti-Stokes frequency: A photon with frequency u0 is absorbed by a Raman-active molecule which at the time of interaction is already in the excited vibrational state. Excessive energy of an excited Raman-active mode is released, molecule returns to the basic vibrational state and the resulting frequency of scattered light rises to u0 + um.

Fig. 1. Raman transitional schemes
About 99.999% of all incident photons in spontaneous Raman undergo elastic Rayleigh scattering. This type of signal is useless for practical purposes of molecular characterization. Only about 0.001% of the incident light produces inelastic Raman signal with frequencies u0 ± um. Spontaneous Raman scattering is very weak and special measures should be taken to distinguish it from the predominant Rayleigh scattering. Instruments such as notch filters, tunable filters, laser stop apertures, and double and triple spectrometric systems are used to reduce Rayleigh scattering for obtaining high-quality Raman spectra.
2. Instrumentation
The Raman system typically consists of four major components:
-
Excitation source (Laser).
-
Sample illumination system and light collection optics.
-
Wavelength selector (Filter or Spectrophotometer).
-
Detector (Photo diode array, CCD or PMT).
A sample is normally illuminated with a laser beam in the ultraviolet (UV), visible (Vis) or near-infrared (NIR) range. Scattered light is collected with a lens and sent through an interference filter or spectrophotometer to separate desired Raman modes or to obtain the Raman spectrum of a sample.
Since spontaneous Raman scattering is very weak, the main difficulty of Raman spectroscopy is separating it from the intense Rayleigh scattering. However, the major problem here is not Rayleigh scattering itself, but the fact that the intensity of stray light from the Rayleigh scattering may exceed the intensity of useful Raman signal in close proximity to the laser wavelength. In many cases, the problem is resolved by simply cutting off the spectral range close to the laser line where the stray light has the most prominent effect. Researchers typically use commercially available interference (notch) filters which cut off the spectral range of ± 80-120 cm-1 from the laser line. This method is efficient in stray light elimination, but does not permit the detection of low-frequency Raman modes in the range below 100 cm-1.
Stray light is generated in the spectrometer mainly upon light dispersion on gratings and strongly depends on grating quality. Raman spectrometers typically use holographic gratings, which normally have much less manufacturing defects in their structure than ruled gratings. Stray light produced by holographic gratings is about an order of magnitude less intense than from the ruled gratings of the same groove density.
Using multiple dispersion stages is another way of achieving stray light reduction. Double and triple spectrometers permit taking Raman spectra without the use of notch filters. In such systems, Raman-active modes with frequencies as low as 3-5 cm-1 can be efficiently detected.
Researchers traditionally used single-point detectors such as photon-counting Photomultiplier Tubes (PMT). But because of the weakness of a typical Raman signal, longer exposure times were often required to obtain Raman spectrum of a decent quality. Therefore, a single Raman spectrum obtained in wave number scanning mode with high-resolution consumed an enormous amount of time, slowing down any research or industrial activity based on the Raman analytical technique. Nowadays, more and more researchers use multi-channel detectors like Photo diode Arrays (PDA), or, even more commonly, Charge-Coupled Devices (CCD) for detecting Raman scattered light. Sensitivity and performance of modern CCD detectors are rapidly improving. In many cases, CCDs are becoming the detectors of choice for Raman spectroscopy.
3. Ways to improve Raman signal intensity
Because the Raman signal is normally weak, researchers are continuously striving to improve its spectroscopy technique. Many different ways of sample preparation, sample illumination or scattered light detection have been invented for enhancing the intensity of the Raman signal. 3.1 - 3.4 (below) examines a few of them.
3.1. Stimulated Raman
It was found that if a sample was irradiated with a very strong laser pulse, new non-linear phenomena could be observed in Raman effect. In comparison with continuous wave (CW) lasers with electric fields of about only 104 Vcm,-1 pulsed lasers with electric fields of about 109 Vcm-1 transformed much larger portions of incident light into useful Raman scattering and substantially improved signal-to-noise ratio.
Stimulated Raman scattering is an example of non-linear Raman spectroscopy. Very strong laser pulses with an electric field strength > 109 Vcm-1 transforms up to 50% of all laser pulse energy into coherent beams at Stokes frequency u0 - um (Fig. 2). Just for comparison, only 0.001% of laser light energy in spontaneous Raman scattering is transferred into Raman signal. Therefore, enhancement in a Raman signal of four-to-five orders of magnitude can be achieved in Stimulated Raman spectroscopy. The Stokes beam is unidirectional with the incident laser beam. Only the mode um (the strongest in the regular Raman spectrum) is greatly amplified. All other weaker Raman-active modes are not present. The Stokes frequency is so strong it acts as a secondary excitation source and generates the second Stokes line with frequency u0 - 2um. The second Stokes line generates a third one with a frequency of u0 - “ 3um etc.

Fig. 2. Stimulated Raman transitional schemes
3.2. CARS
Coherent Anti-Stokes Raman spectroscopy (CARS) is another type of non-linear Raman spectroscopy. Instead of the traditional single laser, two very strong collinear lasers irradiate a sample. Frequency of the first laser is usually constant. However, the frequency of the second one can be tuned in a way that the frequency difference between the two lasers exactly equals the frequency of some Raman active mode of interest. This particular mode will be the only extremely strong mode in the Raman signal. Researchers can obtain only one strong Raman peak of interest using CARS . In this case, monochromator is not necessarily required. A wideband interference filter and a detector behind the filter could work in its place. A more detailed description of CARS using mathematics is below.
Two laser beams with frequencies u1 and u2 (u1 > u2) interact coherently to produce a strong scattered light with frequency 2u1- u2 (Fig. 3). If the frequency difference between two lasers u1 - u2 equals the frequency um of a Raman-active rotational, vibrational or any other mode, then a strong light with frequency u1 + um is emitted.
In other words, to obtain strong Raman signal, the second laser frequency should be tuned in a way that u2 = u1 - um. Then the frequency of strong scattered light will be 2u1 - u2 = 2u1- (u1 - um) = u1 + um , which is higher than the excitation frequency u1 and therefore considered Anti-Stokes frequency. Coherent Anti-Stokes Raman spectroscopy derives its name from the fact that it uses two Coherent laser beams in order to produce an Anti-Stokes frequency signal.

Fig. 3. Transitional scheme for CARS
3.3. Resonance Raman (RR)
Many (especially colored) substances may absorb laser beam energy and generate strong fluorescence, which contaminates Raman spectrum. This is one of the central problems in Raman spectroscopy, especially when UV lasers are used. Nevertheless, it was discovered that instead of fluorescence, some types of colored molecules could produce strong Raman scattering at certain conditions. This effect was called Resonance Raman.
Resonance Raman Effect occurs when excitation laser frequency is chosen in such a way that it crosses the frequencies of electronic excited states and resonates with them. The intensity of Raman bands, which originate from electronic transitions between those states, are enhanced three-to-five orders of magnitude. Not all the bands of spontaneous Raman spectrum are enhanced. The so-called chromophoric group responsible for the molecules' coloration experiences the highest level of enhancement because the chromophoric group normally has the highest level of light absorption.
The highest intensity of Resonance Raman signal is obtained when laser frequency equals the first of the second electronic excited state (Fig. 4). Therefore, tunable lasers are the most appropriate choice. But even when the frequency of the laser does not exactly match the desired electronic excited states, impressive enhancement of Raman signal occurs.

Fig. 4. Resonance Raman transitional schemes
3.4. SERS and SERRS
Surface-Enhanced Raman spectroscopy (SERS) utilizes the following effect: The Raman signal from molecules adsorbed on certain metal surfaces can be five-to-six orders of magnitude stronger than the Raman signal from the same molecules in bulk volume. The exact reason for such dramatic improvement is still under discussion. Because the intensity of the Raman signal is proportional to the square of electric dipole moment P = a E, two possible reasons can be considered: the enhancement of polarizability a and the enhancement of electrical field E. The first enhancement of polarizability a may occur because of a charge-transfer effect or chemical bond formation between the metal surface and molecules under observation, which is called chemical enhancement.
The second one takes into account the interaction of the laser beam with irregularities on metal surfaces, such as metal micro-particles, or roughness profile. It is believed that laser light excites conduction electrons at the metal surface leading to a surface plasma resonance and a strong enhancement of electric field E, known as electromagnetic enhancement.
In all cases, choosing an appropriate surface substrate is very important. The most popular and universal substrates used for SERS are electrochemically-etched silver electrodes, as well as silver and gold colloids with an average particle size below 20 nm.
One disadvantage of SERS is spectra interpretation. The signal enhancement is so dramatic that very weak Raman bands unnoticeable in spontaneous Raman spectra can appear in SERS. Some trace contaminants can also contribute additional peaks. Moreover, because of chemical interactions with metal surfaces, certain peaks, which are strong in conventional Raman, might not be present in SERS at all. The non-linear character of signal intensity as a function of concentration complicates things even further. Very careful consideration of all physical and chemical factors should be taken while interpreting SERS spectra, which makes it extremely difficult for practical use.
Because of such complications, the Surface-Enhanced Resonance Raman spectroscopy (SERRS) technique was developed. It utilizes both the Surface-Enhancement effect and the Raman Resonance effect, so the resulting enhancement in Raman signal intensity can be as high as 1014. But the main advantage of SERRS is its spectra resemble regular Resonance Raman spectra, which makes it much easier to interpret.
Recommended Products:
Acton TriVista Triple Spectrometers
- Superior stray light rejection; collects data down to 5 cm-1 from laser line.
- Software selection of additive and subtractive modes.
- Flexible system allows multiple uses.
Acton Series Monochromators & Spectrographs
- Positrak™ grating stabilization offers simple calibration.
- Optimized coatings for higher throughput.
- Interchangeable grating turrets with a wide selection of gratings.
Acton LS 785 Lens Spectrographs
- Easy wavelength adjustment for 650nm to 830nm laser excitations.
- Optional integrated Raman filter for effective laser line filtering.
- Easy interface to fiber optic probes and microscopes.
PyLoN CCD Cameras
- Cool, quiet and fast!
- Contollerless, LN cooled, highest sensitivity
- Supported by LightField software
PIXIS CCD Cameras
- Lifetime vacuum guarantee for worry-free operation.
- Deep cooling without the need for liquid circulators.
- Up to 1000 spectra/sec data acquisition.