
New Two-Dimensional InGaAs Detector Thermoelectrically Cooled to –85°C
Facilitates Scientific Research
Introduction
Molecular oxygen is one of the most important molecules in maintaining life as well as in mechanisms by which life is extinguished and materials destroyed. For several decades, researchers have been intrigued by the physical and chemical properties of molecular oxygen’s lowest excited state, singlet oxygen (1O2). In particular, singlet oxygen has a unique reactivity that can result in polymer degradation or the death of biological cells. Its role as an intermediate in cell death is exploited by photodynamic therapy (PDT) for cancer, a technique in which light is utilized as a medical tool1,2.
In PDT, a photosensitizer (PS) is incorporated into abnormal tissues and then irradiated with visible light so that it transfers energy to ground-state oxygen via the type II photochemical pathway, producing singlet oxygen (which can be directly detected by its weak 1270 nm emission)3. Owing to the special interest in elucidating the biochemical action of singlet oxygen on the subcellular level, several high-spatial-resolution methods have been proposed to detect 1O2 luminescence using either a single photomultiplier tube (PMT), a linear InGaAs detector array, or a two-dimensional InGaAs detector3.
In this application note, a novel microspectroscopy setup that uses a NIRvana:640 InGaAs camera from Princeton Instruments is evaluated by Dr. Marek Scholz of Charles University (Prague, Czech Republic). Dr. Scholz reports that the new NIRvana® camera’s two-dimensional InGaAs array has allowed himself and fellow members of the Optical Spectroscopy Group headed by Prof. Jan Hála to address the issue of potential spectral overlap of 1O2 phosphorescence with the NIR-extended luminescence of the PS, thus providing an effective means of distinguishing and separating them for the first time4.
Experimental Setup
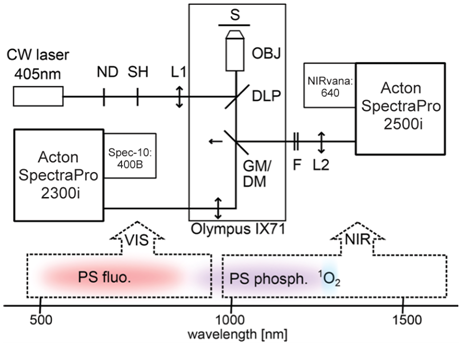
The experimental setup utilizes two detection channels (VIS and NIR) to perform real-time imaging of the very weak near-infrared phosphorescence of singlet oxygen and photosensitizer simultaneously with the visible fluorescence of the photosensitizer. This innovative setup (see Figure 1) enables acquisition of spectral images based on singlet oxygen and photosensitizer luminescence from individual cells. One dimension of the image is spatial and the other is spectral, covering a spectral range from 500 to 1700 nm.
DOI: 10.1039/c4pp00121d – Reproduced by permission of The Royal Society of Chemistry (RSC) on behalf of the European Society for Photobiology, the European Potochemistry Association, and RSC. http://pubs.rsc.org/en/content/articlelanding/2014/pp/c4pp00121d#!divAbstract
The direct, real-time imaging setup, as illustrated in Figure 1, is built around an Olympus inverted fluorescence light microscope and uses a 405 nm constant-wavelength (CW) laser as an excitation source. The laser beam is passed through neutral-density (ND) filters and coupled by a 500 nm dichroic longpass mirror (DLP) into an NIR-corrected objective (OBJ). The illuminated spot on the sample (S) is enlarged to about 94 µm by inserting a lens (L1) in the excitation path. To direct the luminescence emission collected by the objective from the sample to an NIR path for detection, a golden mirror (GM) is inserted. Removing the mirror directs the emission to a VIS path.
In the NIR path, the signal passes through a combination of NIR longpass and shortpass filters (F); the filter combination depends on the specific experiment. The signal is then focused by an achromatic lens (L2, f = 20 cm) onto the entrance slit of an Acton SpectraPro® 2500i imaging spectrograph from Princeton Instruments. The spectrograph is coupled to a NIRvana:640 InGaAs camera, also from Princeton Instruments (see Figure 2). To reduce dark charge, the camera’s NIR-sensitive, two-dimensional focal plane array (FPA) is cooled to −80°C.

The 2500i spectrograph is configured either with a grating (150 g/mm, 1.2 µm blazed) for spectroscopy or a mirror for imaging. To minimize sample photobleaching, the shutter (SH) in the excitation path is controlled by the NIRvana camera and opened only during exposure times. In the imaging mode, the area of 0.34 x 0.34 μm on the sample is magnified to the 20 x 20 µm pixel size of the NIRvana’s FPA, which corresponds to 58x magnification. At 1275 nm (1O2 phosphorescence band), the spatial resolution due to the diffraction limit is about 1.4 µm, according to the Rayleigh criterion, as determined by the objective numerical aperture of 0.55. In the spectroscopy mode, the spectral resolution of the system, determined by the width of the entrance slit of the spectrograph, is 10 nm.
Alternatively, in the VIS path, a Spec-10:400B back-illuminated CCD camera from Princeton Instruments is coupled to an Acton SpectraPro 2300i imaging spectrograph. Recently, to simultaneously detect VIS and NIR spectral regions, the setup was modified by replacing the golden mirror with a shortpass dichroic mirror (DM). The original set of filters has also been modified. Refer to Scholz et al. 2014 for further details regarding the experimental setup.
Results and Conclusions
The introduction of the spectral imaging method provides a powerful new tool for distinguishing and separating potential spectral overlap of 1O2 phosphorescence with the NIR-extended luminescence of the photosensitizer. It can be applied to any PS manifesting NIR luminescence. Some of the data is presented below; more can be found in Scholz et al. 2014
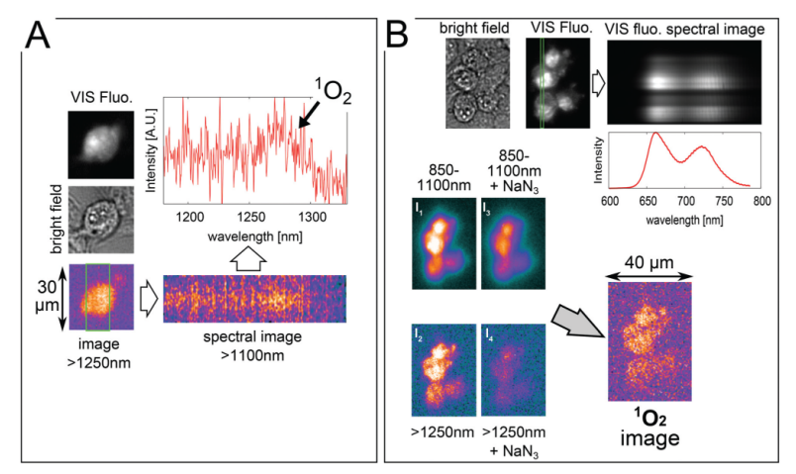
The images displayed in Figure 3A were captured while continuously irradiating a cell, incubated for 5 hours with 100 μM TMPyP in a D2O-based saline solution, with 1 W/cm2 laser power. The >1250 nm image (using a combination of 850 and 1250 nm longpass filters) was obtained by adding the last four frames (i.e., a total of 20 sec exposure) from a series of
10 consecutive frames with exposure times of 5 sec each. Subsequently, a spectral image was obtained with a 25 sec exposure. The brightfield and fluorescence images were taken afterward. The spectrum shows that 1O2 phosphorescence is the dominant spectral feature. For different cells, it was verified that when a 1350 nm longpass filter was used in place of the
1250 nm longpass filter, the >1250 nm image intensity dropped by more than 70%.
DOI: 10.1039/c4pp00121d – Reproduced by permission of The Royal Society of Chemistry (RSC) on behalf of the European Society for Photobiology, the European Photochemistry Association, and RSC. http://pubs.rsc.org/en/content/articlelanding/2014/pp/c4pp00121d#!divAbstract
The images displayed in Figure 3B were captured from different cells incubated using the same procedure. Four near-infrared images were taken by irradiating these cells with 2.5 W/cm2 laser power. First, the 850–1100 nm image (I1) using a combination of 850 nm longpass and 1100 nm shortpass filters was acquired with a 1 sec exposure. Next, the >1250 nm image (I2) was taken with a 5 sec exposure. Afterward, the ‘850–1100 nm + NaN3’ image (I3) with a 1 sec exposure and the ‘>1250 nm + NaN3’ image (I4) with a 5 sec exposure were acquired after adding an aliquot of 10 mM NaN3 to the sample, gently stirring it, and then leaving it in the dark for 5 minutes. A slight drop in the 850–1100 nm signal was observed, which is likely indicative of a certain level of photobleaching. In the >1250 nm image (I4), however, a much larger drop in signal was observed after the addition of the NaN3. The 1O2 signal is assumed to be almost totally quenched in the I4 image, which is formed predominantly by the NIR background luminescence of the TMPyP. A combination of these four images I1–I1 allows the researchers to reconstruct the true image of 1O2 luminescence
This new experimental setup, which employs an NIR-sensitive, two-dimensional InGaAs focal plane array as a detector, has proven sufficiently sensitive to yield 1O2 images and spectral images of individual D2O-treated fibroblast cells incubated with TMPyP. The setup’s overall efficiency for 1O2 phosphorescence detection was estimated to be 1–3%. The primary limiting factor was determined to be the numerical aperture of the objective (N.A. = 0.55).
Enabling Technology
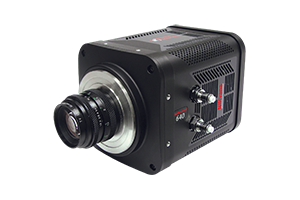
The main advantage of the NIRvana:640 camera (see Figure 4) over previously utilized 1D InGaAs detectors, according to Dr. Scholz, is the NIRvana detection array’s two-dimensionality, which leads to a dramatic reduction of acquisition times and avoids some of the problems caused by photobleaching of the sample.

The NIRvana:640 has been specially designed by Princeton Instruments for scientific research applications requiring superb linearity and excellent near-infrared sensitivity. Its 640 x 512 InGaAs detection array, which delivers response from 0.9 µm to 1.7 µm, can be thermoelectrically cooled as low as –85°C in order to minimize thermally generated noise and improve signal-to-noise ratio.
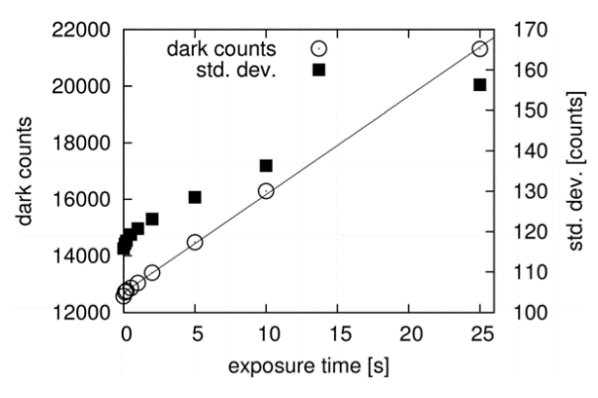
Seeking to quantify performance parameters for their new microspectroscopy setup, the Prague group conducted an experiment to determine the dark noise of the NIRvana:640 (at −80°C). The results are presented in Figure 5.
DOI: 10.1039/c4pp00121d – Reproduced by permission of The Royal Society of Chemistry (RSC) on behalf of the European Society for Photobiology, the European Photochemistry Association, and RSC. http://pubs.rsc.org/en/content/articlelanding/2014/pp/c4pp00121d#!divAbstract
The NIRvana:640 InGaAs camera also provides 16-bit digitization and low read noise for outstanding dynamic range. Furthermore, the latest Princeton Instruments LightField® 64-bit data acquisition software, available as an option, affords complete control over all NIRvana hardware features via an exceptionally intuitive user interface. LightField provides automatic defect correction, precision exposure control, and a host of innovative functions for easy capture and export of imaging and spectral data.
Summary
Singlet oxygen, the first excited state of molecular oxygen, is a highly reactive species that plays an important role in a wide range of biological processes, including cell signaling, immune response, macromolecule degradation, and elimination of neoplastic tissue during photodynamic therapy4. Often, a photosensitizing process is employed to produce singlet
oxygen from ground-state oxygen.
An innovative experimental setup developed and used at Charles University in Prague now permits researchers to perform direct, real-time imaging of singlet oxygen while addressing the issue of potential spectral overlap with emitted light from the photosensitizing agent. This fastdata-acquisition microspectroscopy setup relies on the two-dimensional array and exceptional near-infrared sensitivity of the Princeton Instruments NIRvana:640 InGaAs detector.
References
- Schweitzer C. and Schmidt R. Physical mechanisms of generation and deactivation of singlet oxygen. Chem. Rev. 103, 1685–1757 (2003).
- Skovsen, E. Progress report: Non-linear two-photon singlet oxygen emission microscopy. Department of Chemistry, University of Aarhus, Denmark (2004).
- Hu B., He Y., and Liu Z. NIR area array CCD-based singlet oxygen luminescence imaging for photodynamic therapy. Journal of Physics: Conference Series 277 (2011).
- Scholz M., Dědic R., Valenta J., Breitenbach T., and Hála J. Real-time luminescence microspectroscopy monitoring of singlet oxygen in individual cells. Photo
Further Information
Related Products
Overview of the advantages of the products available which are optimized for singlet oxygen applications.

Get In Touch
Speak to a member of our team about your specific application, and what we can do to help you.

Join Our Mailing List
Want to be up to date on the latest offers and news from Teledyne Princeton Instruments? Join our mailing list today.