
Introduction
Laser Raman spectroscopy is a powerful technology that is successfully used in a variety of scientific research and industrial applications. The cross-section afforded by Raman scattering is typically orders of magnitude lower than that of other optical spectroscopic methods (such as infrared absorption, laser-induced fluorescence, and ultraviolet-visible absorption), which in many cases serves to limit its utility. And while several innovative approaches (including surface-enhanced Raman spectroscopy, resonance Raman spectroscopy, and UV Raman spectroscopy) have been developed that effectively enhance the Raman scattering cross- section in order to improve sensitivity, these methods are not generally applicable to all chemicals and materials.
In this note, we discuss the advantage of an aberration-free spectrograph design for performing Raman spectra measurements. IsoPlane 81, a fully integrated spectrograph system from Princeton Instruments, was used for the demonstration.
Since both coma and astigmatic aberrations are eliminated at all wavelengths by the IsoPlane 81 design, uniform diffraction-limited imaging and spectral resolution are achieved across the detector plane. This unique feature allows spectral binning over the entire detector so as to improve the signal-to-noise ratio of the data without losing any spectral resolution.
In order to fully utilize the etendue (spread) of the system, a round-to-linear fiber bundle probe was employed for spectra collection. The light throughput provided by the bundle was observed to be significantly better than the throughput of a single-fiber setup.
Although only a few chemicals were measured in this study, the experimental setup described herein is readily applicable to different materials. The setup can also easily be extended to allow hyperspectral imaging or spectral microscopic imaging measurements via the use of the IsoPlane 81 system’s versatile CUBE accessories.
Why IsoPlane?
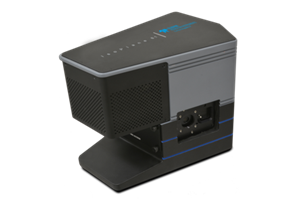
IsoPlane 81 is the latest aberration-free spectrograph from Princeton Instruments. Outstanding performance makes it a perfect system for many different spectroscopy and imaging applications in research and industry.
Experimental Setup
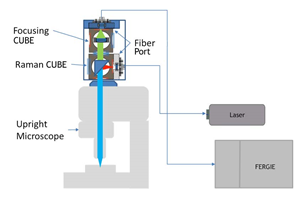
An IsoPlane 81 integrated imaging spectrograph system (see Figure 1) with a built-in, back-illuminated CCD camera was used for all data collection reported. The 256 x 1024 photosensitive array of the detector (pixel pitch: 13 x 13 µm) was thermoelectrically cooled to -55 °C for the study, which utilized a spectrograph focal length of 80 mm, a 600 g/mm grating, and a 785 nm wavelength-stabilized multimode laser coupled to a Raman probe through a 105 µm core fiber cable.
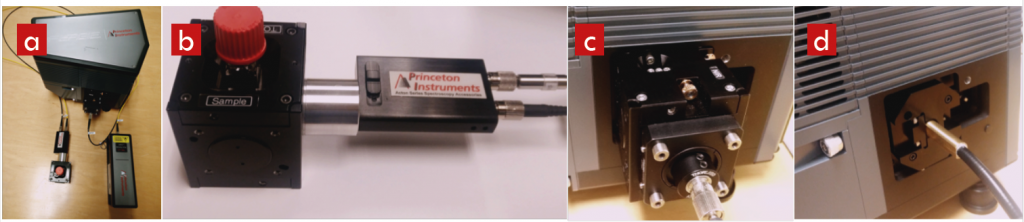
Two distinct setups were used to couple the Raman scattering into the IsoPlane 81 spectrometer: (1) the first setup coupled the scattered light through a single 400 µm core fiber cable; (2) the second setup coupled the scattered light through a round- to-linear fiber bundle. The single-core fiber cable was connected to a Focusing CUBE, which focused the light on the slit of the spectrometer. A 100 µm slit was used for all single-fiber data collection. The fiber bundle, meanwhile, had 50 silica cores with a 50 µm core size. The linear end of the bundle was placed at the slit plane of the spectrometer and no physical slit was used for data collection with the fiber bundle.
An atomic emission (AE) lamp and a quartz tungsten halogen (QTH) lamp from Princeton Instruments were also utilized to create some of the data and images presented in this note.
Chemical samples were obtained from commercial sources without any further purification.
Results & Discussion
Characterization of Diffraction-Limited Imaging Quality
The IsoPlane 81 system’s proprietary optical design eliminated aberrations (coma and astigmatism) at all wavelengths. Figure 2 shows the image of the linear end of the fiber bundle, with its 50 cores, which was placed at the slit entrance. The zoom-in image on the right shows tight spacing with a vertical length of 2.5 mm that slightly underfills the vertical dimension of the slit entrance. Each fiber is clearly distinguishable with a diameter of 3.85 pixels (50 µm).
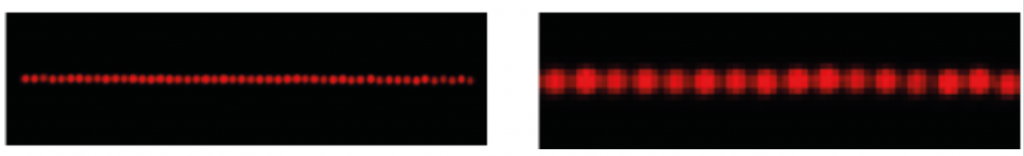
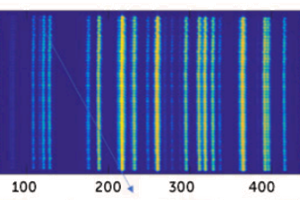
Figure 3 presents hyperspectral images of the fiber bundle using (a) a QTH lamp and (b) an AE lamp as light sources, respectively. The 600 g/mm grating provides spectral coverage of ~300 nm centered at 800 nm
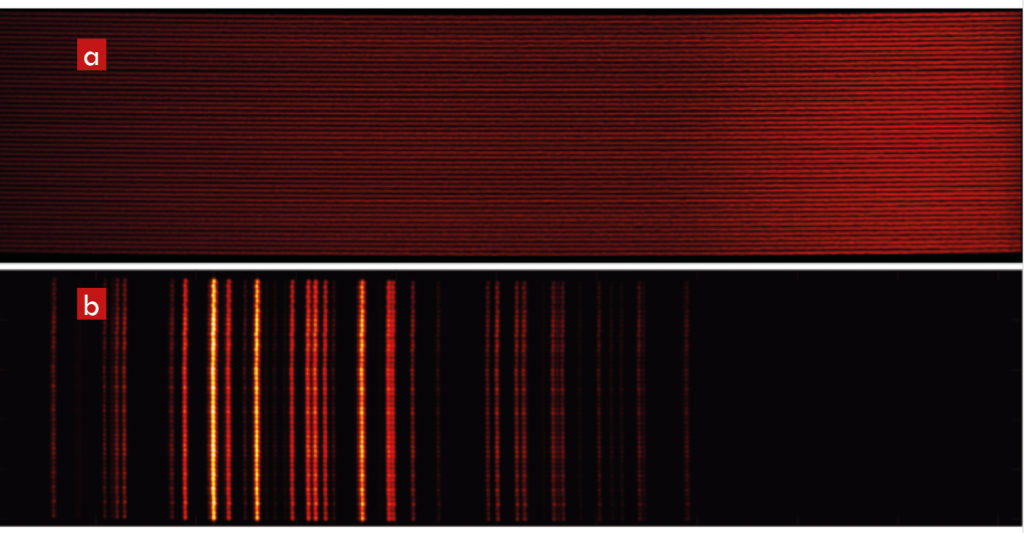
For comparison, an image of a slightly different fiber bundle that was previously collected using a Czerny-Turner (CT) spectrometer is shown as an inset of Figure 3(b). The Czerny-Turner design and its variations represent perhaps the most commonly employed optical design for grating-based spectrometers. This conventional, proven technology uses a minimal number of optics and provides sufficient performance for simple spectral data collection. The optimum performance of Czerny- Turner spectrometers, however, is only achievable at the center of the focal plane. Due to aberration effects, the image quality significantly degrades as one moves farther away from the center.
By contrast, the proprietary aberration-free design of the IsoPlane 81 system eliminated all aberration effects. In Figure 3(a), each horizontal line corresponds to a QTH light spectrum from one fiber – and diffraction-limited spatial resolution is maintained across the entire spectral range. In Figure 3(b), each vertical line corresponds to a discrete atomic emission line from the AE lamp – and diffraction-limited spatial resolution is maintained both vertically (spatial axis) and horizontally (spectral axis).
Figure 4 shows the spectrum of the AE lamp acquired by vertically binning the AE image that is presented in Figure 3(b). With a fiber bundle as the collection optics, the exposure time is 1 msec.

Small emission lines can be measured, as shown in Figure 4(b), thanks to the IsoPlane 81 spectrograph system’s high light throughput and deep-cooled CCD.
Raman Measurements of Solid & Liquid Samples
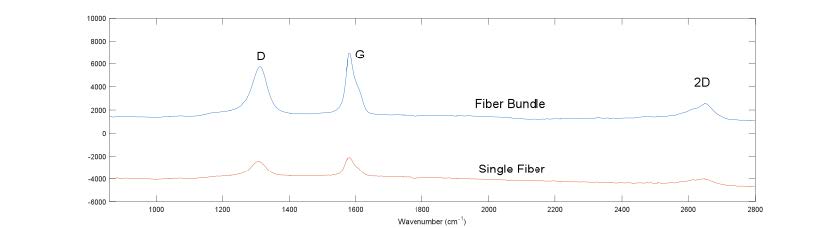
A 785 nm laser with maximum output of 475 mW was used for all Raman spectra measurements. The Raman spectra of graphite presented in Figure 5 were collected using either a fiber bundle or a single-core fiber to couple the Raman scattering into the IsoPlane 81 spectrometer. The fiber bundle delivered about a 3x signal improvement over the single fiber. The strong D band shown in Figure 5 indicates numerous defects in the graphite sample, while the asymmetric shape of the 2D band agrees with the sample’s multilayer graphene structure.
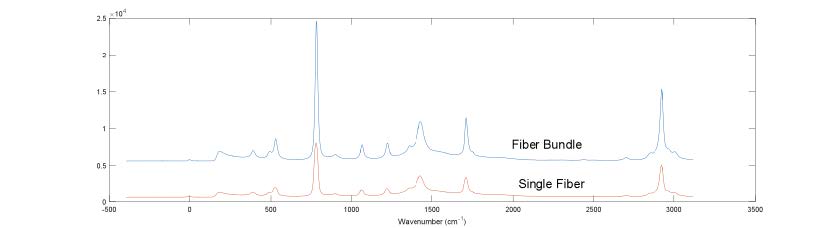
Similar signal improvement was seen when measuring a liquid (acetone) sample, as evidenced in Figure 6. The data collected with the fiber bundle is again about 3x stronger than the data collected with a single fiber.
Conclusions
In this note, we demonstrated the advantage of using an aberration-free spectrograph to measure Raman spectra. The experimental setup utilized is a preliminary attempt at leveraging the power of the IsoPlane 81 system to improve data quality. Such a high-performance system is particularly important for Raman measurements of samples like graphite or graphene materials, where the laser power needs to be carefully controlled so as to avoid sample damage. Uniform high resolution across the entire focal plane is also required in order to measure properties of graphene and graphite accurately, including the thickness of graphene structure and defects.
Besides the spectroscopic measurement of materials, we expect the IsoPlane 81 spectrograph to be used for hyperspectral imaging and spectral microscopic imaging applications where an aberration-free system can provide unrivaled performance.
Further Information
Aberration-free spectrograph improving SNR of spectra
Find out how aberration-free spectrographs significantly improve the signal-to-noise ratio of spectral data.
Confocal Raman Microscopy Study of Biological Tissues
Technical note describing how aberration-free spectrographs greatly improve biological spectral data.
IsoPlane 81 Research Stories
Find out more about how researchers are utilizing the IsoPlane 81 compact spectrograph.