
Abstract
For years spectra have been measured using traditional Czerny-Turner (CT) design dispersive spectrographs. Optical aberrations inherent in the CT design can give spectra with poor spectral resolution, low signal-to-noise ratios (SNR) and distorted peak shapes. These aberrations grow worse towards the edges of the focal plane, causing some researchers to abandon these regions of their sensors. A new dispersive spectrograph using a Schmidt- Czerny-Turner (SCT) design greatly reduces optical aberrations giving spectra with better spectral resolution, signal-to-noise ratios and peak shapes. The performance of this spectrograph is excellent across the focal plane so researchers can now use an entire CCD sensor to take their data.
Introduction
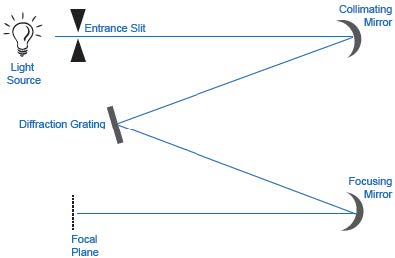
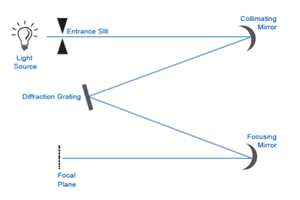
For decades dispersive spectra have been measured using the traditional Czerny-Turner (CT) spectrograph design seen in Figure 1. In the CT design light passes through an entrance slit, reflects off a collimating mirror, is dispersed by a diffraction grating and is then brought to a focus by a focusing mirror at the focal plane of the instrument.
The fluence of an optical system such as a spectrograph is defined as the number of photons hitting a unit area as such:
Φ = N/A
Where Φ = Fluence N = Number of photons A = Area, typically measured in cm2 or meters2
For a spectrograph this area can be the number of pixels illuminated on a charge coupled device (CCD) sensor. A high fluence spectrograph has many photons striking few pixels. This means the light is less spread out on the x axis giving narrower peaks with a higher spectral resolution. It means that with more photons per pixel peak intensities will be greater, giving peaks with an increased signal-to-noise ratio (SNR), defined as:
SNR = Signal/Noise
Where SNR = Signal-to-Noise Ratio Signal = Height of peak Noise = Baseline noise level near where the signal is measured
Since the noise represents y-axis measurement error, a high SNR means the size of the signal is large compared to the size of the noise which is preferred.
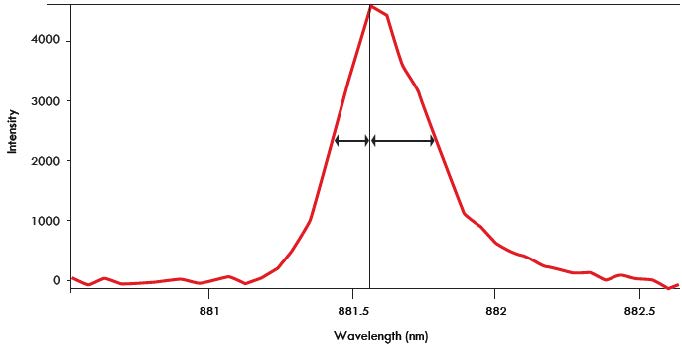
Inherent in the design of CT spectrographs are optical aberrations including field astigmatism and coma. Field astigmatism results from using a lens or mirrors to image a source off axis, and causes images to become elongated in the horizontal and vertical directions. Coma results from using mirrors to image a source off axis, adds a comet-like tail to images and causes spectral peaks to be asymmetrically broadened as seen in Figure 2.
Field astigmatism and coma cause photons to spread out over a large pixel area reducing fluence. The result is that light is spread along the x-axis lowering spectral resolution. Also, with fewer photons per pixel peaks will be shorter with a reduced SNR. When measuring spectra a high fluence spectrograph is preferred.
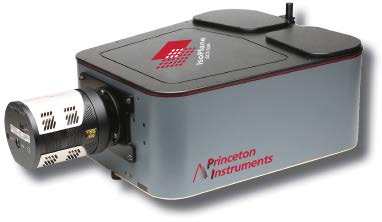
A new dispersive spectrograph design from Princeton Instruments, the Schmidt-Czerny-Turner (SCT) or IsoPlane® SCT 320, has greatly reduced levels of optical aberrations compared to traditional Czerny-Turner spectrographs. Shown below in Figure 3, the IsoPlane has a 320 mm focal length and a three position on axis grating turret. Camera focus is optimized using a micrometer attached to the focusing mirror
Thanks to its optical design, the IsoPlane has zero astigmatism at all wavelengths across the entire focal plane and greatly reduced levels of coma. Thus the IsoPlane has higher fluence than a traditional CT spectrograph. The advantages of using this high fluence spectrograph to measure spectra are discussed below.
Improved Emission Spectroscopy with the IsoPlane
Atomic emission lines have a narrow natural bandwidth and so are unusually sensitive to optical aberrations. Spectra of the 435 nm Hg emission line measured with the Czerny-Turner and Schmidt-Czerny-Turner spectrographs are shown in Figure 4.

When measuring spectral lines the conserved quantity is peak area, which means broad peaks must be short and narrow peaks must be tall. This also means the area of a peak should be the same regardless of the spectrograph on which it is measured. The spectrum of the 435 nm Hg emission line measured with a CT spectrograph is shown in red in Figure 4. This peak is broad and 32% of its intensity is in the wings so it has poor spectral resolution.
The spectrum of this same line measured with an IsoPlane is seen in blue in Figure 4. The IsoPlane peak is narrow, only 5% of the peak intensity is in the wings and it has a higher spectral resolution than the peak measured with a CT spectrograph. The IsoPlane peak is also twice as tall as the CT peak, meaning the IsoPlane spectrum has a better SNR. These improvements are a result of the reduced optical aberrations and thus greater fluence of the IsoPlane compared to a CT spectrograph
Also note in red in Figure 4 that the Hg emission line is asymmetrically broadened because of coma. By greatly reducing coma the IsoPlane peak in blue is symmetrical. In dispersive spectroscopy there is a trade-off between SNR and resolution; narrow slits must be used to achieve high spectral resolution but they do not pass much light. By eliminating astigmatism and reducing coma as seen in Figure 4, the IsoPlane overcomes this trade-off by giving spectra that have improved spectral resolution and an improved signal-to-noise ratio.
Improved Raman Spectroscopy with the IsoPlane
The advantages of the IsoPlane for Raman spectroscopy are clearly seen in Figure 5, which shows a comparison of the 802 cm-1 Raman peak of liquid cyclohexane measured with a CT spectrograph and an with IsoPlane.
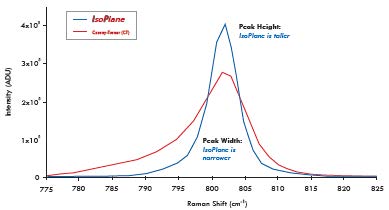
The peak in red measured with a CT spectrograph has a full width half maximum (FWHM) of 9.16 cm-1. The same peak in blue measured with the IsoPlane has a FWHM of 4.95 cm-1, almost twice as narrow as the peak measured with a CT spectrograph. This means the IsoPlane can measure Raman spectra at higher spectral resolution than a CT spectrograph.
The peak height of the spectrum measured with the IsoPlane is higher than that measured with the CT spectrograph, meaning the IsoPlane gives Raman spectra with an improved signal-to-noise ratio. Again, by reducing optical aberrations and thus increasing fluence, the IsoPlane gives spectra with improved spectral resolution and SNR.
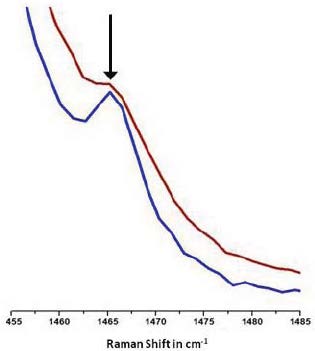
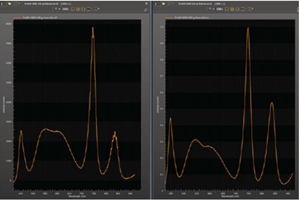
Another advantage of reducing optical aberrations is the ability to resolve spectral features that are close together. The ability of the IsoPlane to tease previously unseen peaks from a Raman spectrum is seen in Figure 6.
The peak denoted by the arrow in Figure 6 is the 1465 cm-1 Raman peak of cyclohexane. The spectrum in red was measured with a CT spectrograph. Note how this peak is barely resolved. The spectrum of the same peak measured with the IsoPlane is plotted in blue in Figure 6. In this spectrum the 1465 cm-1 peak is clearly visible. This is due to the IsoPlane’s better spectral resolution and is an example of how increasing resolution can increase the information content of a spectrum, allowing researchers to learn more from their data.
Quality Data From All Portions of the Focal Plane
The optical aberrations inherent in the traditional CT design are small at the center of the focal plane and grow larger towards the edges. This causes a deterioration of data quality at the top, bottom, left, and right portions of the sensor. This can be seen in Table 1, which lists the FWHM of the 802 cm-1 Raman band of liquid cyclohexane measured with the CT and SCT spectrographs at different points across the focal plane of a CCD.
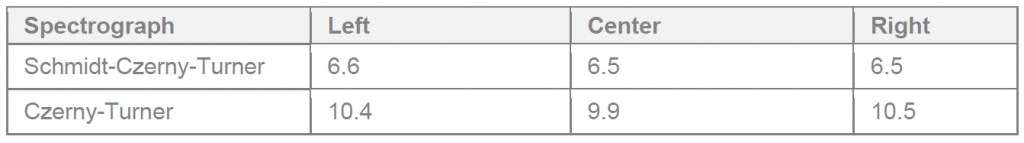
Note that across the entire sensor the IsoPlane’s spectral resolution is better than that of the CT spectrograph, because the IsoPlane’s optical aberrations are small at all points in the focal plane, not just at the center as with a CT spectrograph. These data show users can trust data obtained with the IsoPlane measured at the left edge, right edge, and center of their CCD sensor.
Conclusions
The data in this paper have shown that by decreasing optical aberrations and increasing fluence, the IsoPlane gives spectra with better spectral resolution and SNR compared to Czerny-Turner spectrographs. Higher spectral resolution means peaks that are too close together to be resolved by a CT spectrograph can be clearly seen with the IsoPlane.
Unlike the CT spectrograph, where aberrations lower the quality of data measured away from the center of the focal plane, the IsoPlane has negligible optical aberrations across the entire focal plane allowing researchers to trust data measured anywhere on the sensor.
Acknowledgements
Princeton Instruments would like to thank Dr. Sam Kleinman of the Van Duyne research group at Northwestern University for his contributions to this note.
Further Reading
Better Imaging with a Schmidt-Czerny-Turner Spectrograph
Article describing the advantages of SCT spectrograph design for entire focal plan imaging.
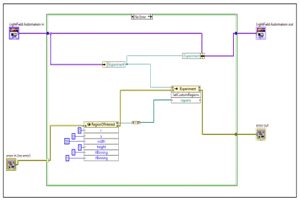
Instrument Automation via National Instruments LabVIEW
A step-by-step guide into automating a custom region of interest to showcase how to automate using LabVIEW.
Automated Wavelength and Intensity Calibration to Improve Spectra
Article describing the advantages of IntelliCal wavelength and intensity calibration with LightField.