
This document focuses on LightField features to enhance the user experience when operating Princeton Instruments spectroscopy systems.
How can I see individual frames as they are collected?
When averaging or summing multiple frames, sometimes LightField does not display individual frames as they are collected. Instead, LightField displays the “waiting for first live frame” message.

Answer:
It is possible to see individual frames as they are being collected. You can access this setting using the procedure outlined below.

Can’t find Advanced Online Processes? In order to access Advanced Online Processes, set the number of Exposures per Frame to a number greater than one. LightField will then display this menu item.
For example, here is a screenshot using a Princeton Instruments NIRvana scientific camera to perform the aforementioned evaluation of novel InAs-based SWIR emitting quantum dots as in vivo imaging agents.
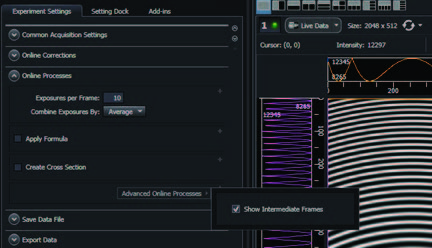
That’s it! After Show Intermediate Frames is selected, LightField will display individual frames during data acquisition.
Why would you want to perform a wavelength calibration when collecting an image, especially when the image only displays pixel position?
Before collecting any spectroscopic images or spectra using LightField, we recommend that you first perform an IntelliCal wavelength calibration.
Answer:
Any spectroscopic data, whether a spectrum or an image of dispersed spectral data, becomes much more useful when it contains wavelength data. If an image is acquired without wavelength calibration, it simply displays pixel positions. If you take a cross-section of the image, it still displays intensity vs. pixel rather than intensity vs. wavelength. LightField and IntelliCal give you the ability to perform precise wavelength calibration and to have this calibration data included in images and spectra.
The following instructions show how to display wavelength data for your spectral image:
Step 1:
Set the spectrograph to a desired center wavelength and perform wavelength calibration using IntelliCal. Calibration can be fixed wavelength or broadband.
Step 2:
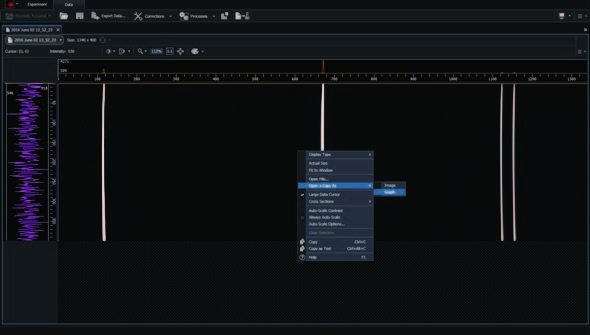
Acquire an IMAGE of the light source or sample emission. In the example below, the image contains four vertical lines which are slit images of the IntelliCal Hg lamp emission. In this example, the spectrograph was set to a center avelength of 546.074 nm.
Step 3:
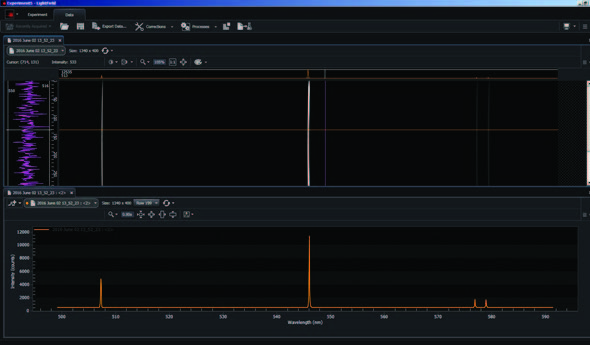
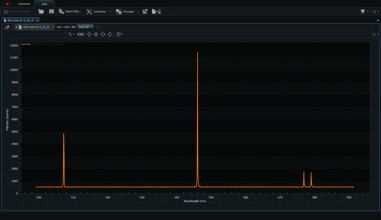
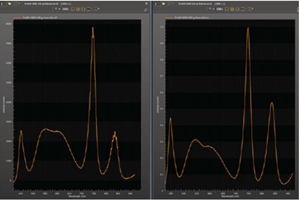
Right-Click on the image and select “Open a Copy As” and then select “Graph”. This should result in the original image plus a graph of the data as shown below.
Step 4:
Synchronize the image to the graph. This is accomplished by selecting the Synchronization Icon and then selecting the file to synchronize from the pull down menu.
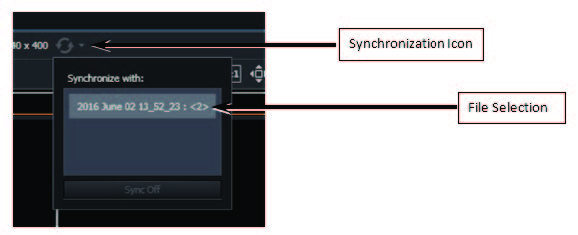
That’s it! After the data is synchronized, when you position your cursor on any part of the image, it also moves to the corresponding position on the graph and displays wavelength calibration.
Optional Display of Wavelength Calibration from Images
As an option, you can display a cross-section (spectra or graph) of your recently acquired image without synchronizing files. Simply follow these following three steps.
Note: The first two steps in this procedure are identical to Wavelength Calibration with Synchronized Data (above).
Step 1:
Set the spectrograph to a desired center wavelength and perform wavelength calibration using IntelliCal.
Step 2:
Collect an IMAGE of the light source or same emission. In the example below, the image contains four vertical lines which are slit images of the IntelliCal Hg lamp emission. The spectrograph was set to a center wavelength of 546.074nm.
Step 3:
Right-Click on the graph and select “Display Type” ![]() “Graph”
“Graph”
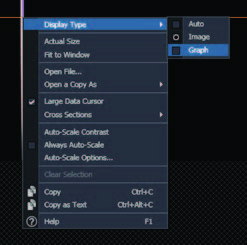
The resulting graph will display a single row cross-section of the data with wavelength calibration.
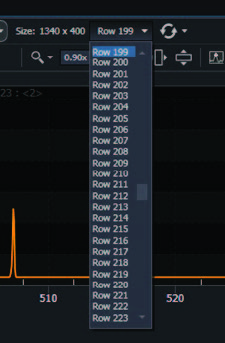
Note that the default row for this cross section will be the vertical center of the sensor. In the example above, the default row was 199 however you can set this to any row using the following pull down menu.
Further Reading
Automating Acquisition with MATLAB During Temperature Changes
A guide on how to automate data acquisition in respect to changing camera temperature using MATLAB software.
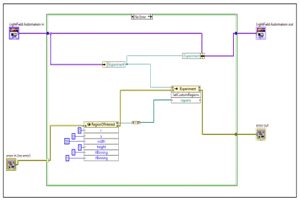
Instrument Automation via National Instruments LabVIEW
A step-by-step guide into automating a custom region of interest to showcase how to automate using LabVIEW
Automated Wavelength and Intensity Calibration to Improve Spectra
Article describing the advantages of IntelliCal wavelength and intensity calibration with LightField