
Raman Scattering
Raman spectroscopy is an optical scattering technique that is widely used for the identification of materials and the characterization of their properties. It is commonly applied in material science, chemistry, physics, life science and medicine, the pharmaceutical and semiconductor industries, process and quality control and forensics.
Raman scattering is an inelastic spectroscopy technique meaning incoming light undergoes a change in color and is scattered with a different energy. The Raman process specifically describes the interaction of incident light with molecular vibrations and rotations in a material.
Light can either excite vibrations and lose energy (redshift) or pick up energy from present vibrations (that are typically thermally excited). As the shift in energy is mostly dependent on the material composition and structure and not the wavelength of the excitation light, Raman spectroscopy measures the energy shift of the Raman scattered light relative to the incident light energy which is characteristic to the sample that is being investigated.
Raman spectroscopy is extremely adaptable to different experimental configurations, from compact handheld instruments to super high-resolution multistage lab systems. It is also adaptable to different samples in solid, liquid or gas phases, from solid state crystals to proteins in the body. Raman scattering is non-destructive and requires little to no sample preparation.
Raman scattering is named after Chandrasekhara Venkata Raman and was discovered in 1928 by Raman and Kariamanikkam Srinivasa Krishnan and in parallel by Grigory Landsberg and Leonid Mandelstam. The actual breakthrough for Raman spectroscopy as an analytical technique started with the invention of the laser in the 1960s.
The early Raman scattering experiments used filtered sunlight or light from atomic emission lamps as incident light sources. It turns out though that the Raman scattering process is extremely weak, laser light however can be produced with much higher intensity, leading to stronger Raman signals. Today Raman spectroscopy is a ubiquitous technique due to the availability of affordable laser source and high performance filters.
The Raman Spectrum
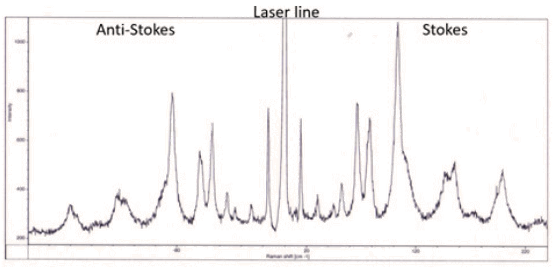
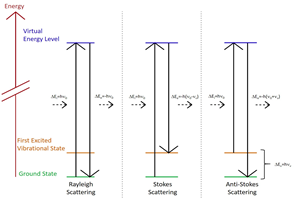
The measurement output of a Raman spectroscopic measurement is a Raman spectrum which contains several components due to the different directions light scatters from the samples. Spectral lines produced by Raman scattering correspond to the different vibrational modes of the sample material or molecule. They are distributed around a spectral line at the excitation laser wavelength due to elastic Rayleigh scattering.
Raman spectroscopy traditionally uses units of wavenumbers (cm-1) to measure the energy shift of the Raman bands relative to the laser line. If the Raman scattering signal is located at wavelength λRaman[nm] the Raman shift [cm-1] is related to the wavelength of the excitation laser λLaser[nm] by:
Raman lines with higher energy than the laser line (lower wavelength) are referred to as Anti-Stokes lines where the scattered light gains energy from interacting with existing vibrations in the sample. Raman lines with lower energy (higher wavelength) occur when the incident light loses energy by exciting molecular vibrations. Energy in molecular vibrations is excited by thermal excitations so as the temperature of the sample decreases the intensity of the Anti-Stokes bands as less vibrational energy will be in the material. Specific energy ranges in the Raman spectrum are often referred to as the low frequency or THz Raman regions (below 200 cm-1), the fingerprint region (up to 1800 cm-1) and the high wavenumber region (above 2800 cm-1).
Material Identification and Quantification
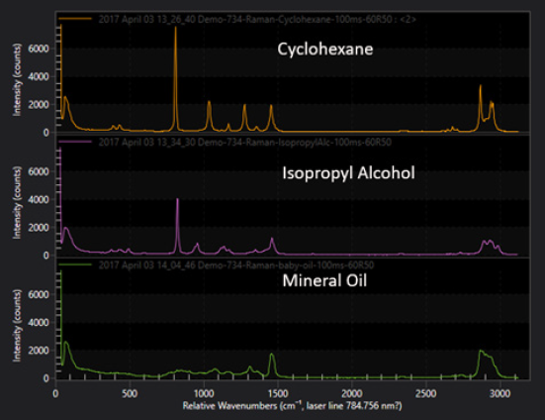
Material identification is one of the most important applications of Raman spectroscopy. The vibrations of a material are determined by its specific arrangement of molecular bonds and symmetries. Raman spectra are characteristic of a specific material, building a unique fingerprint that allows for identification of a specific material or detection of contaminations in a material.
In a well calibrated measurement Raman spectroscopy can be used to quantify the amount of material as the intensity of the Raman lines is proportional to the concentration of the analyte in the probe volume.
A simple application is the determination of mixture ratios of 2 substances by comparing the relative strength of specific Raman bands in the spectrum. The sensitivity of Raman spectroscopy is extremely high and allows for detection down to trace levels of a material which could be anything from contamination in a chemical solvent, a biomarker in a cell or traces of explosives on a sample, applications where Raman spectroscopy is widely used.
Raman Spectroscopy for Internal and Environmental Sensing
The nature of the Raman process makes it a great tool for the investigation of the internal properties of materials. The size and position of spectral lines is extremely sensitive to changes in molecules, lattice or crystal structure or the presence of defects in a material.
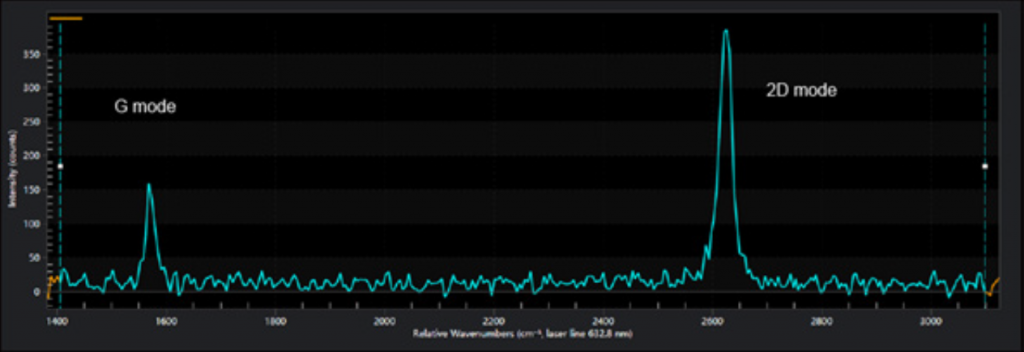
For example, graphene is a single layer of Carbon where the atoms are arranged in a honeycomb structure and is the building block of graphite (many graphene layers stacked on top of each other). Raman spectroscopy has become the standard tool for identifying the number of graphene layers stacked on top of each other. The so called 2D band, around 2650 cm-1, is changing its structure and symmetry between single and double layers of graphene.
The influence of autofluorescence in Raman measurements can be The so-called D band around 1300 cm-1, which is absent in pure graphene, has been found to indicate the presence and concentration of defects.
The interactions between the atoms of a material can be very sensitive to the external physical and chemical environment as well. Understanding the influence of any environmental parameter on the Raman spectrum, makes a Raman measurement an effective sensing tool for this parameter.
Raman as a sensing tool is particularly useful in microscopic and remote observations where environment parameters cannot be accessed by other techniques. Among the quantities routinely measured by Raman spectroscopy are temperature, pressure, stress/strain and pH values.
Summary
Raman spectroscopy analyzes the vibrations of molecules and crystals. It is one of the most common spectroscopic techniques for material identification and determining a material’s physical and chemical environment. Raman spectra use units of wavenumbers to measure the energy shift of scattered light relative to the energy of the excitation laser.
Further Reading
Raman Spectroscopy in Life Sciences
Brief overview of how Raman spectroscopy is advantageous for life science applications, such as characterizing biomolecules and for biosensing.
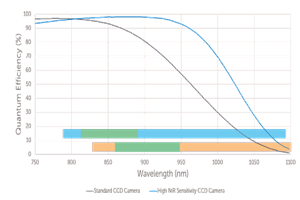
Deep Depleted Cameras for In vivo Raman
Raman spectroscopy is an important technique for life sciences, however it is a weak effect and requires highly sensitive cameras that can detect very low signals.
Related Raman Products
Raman spectroscopy can be implemented in various ways dependent on the sample being studied. Therefore it is important to use the correct equipment. Find out more about your options here.