
Introduction
Raman spectroscopy has become a widely used tool in biomedical engineering and life science for its diagnostic potential. It is used in medical research, studying the biochemical environment of single cells or monitoring the reaction of cells to drugs, pharmaceutical industry for process and quality control in the manufacturing of drugs. In medical diagnostics Raman spectroscopy has been recognized for its high diagnostic potential:
- • It is a non-destructive measurement technique that can be used without molecular labels that could interfere with biochemical processes
- • Unlike infrared (IR) spectroscopy, Raman spectroscopy can be easily applied on aqueous substances
- • It can detect and quantify biomolecules with high precision, sensitivity and specificity
- • It can diagnose disease in tissue in situ promising to obtain diagnostic information faster than traditional lab methods
- • It can be integrated in multiple measurement configurations like microscopy and endoscopy
What is Raman spectroscopy?
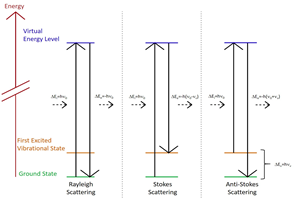
Spontaneous Raman scattering is an inelastic process where incident laser light interacts with molecular vibrations in the sample. The laser couples to specific Raman active molecular, vibrational modes, losing energy which can be spectroscopically detected as a redshift in wavelength relative to the incident light. Raman spectroscopy measures the change in energy of the Raman spectral lines relative to the energy of the excitation laser.
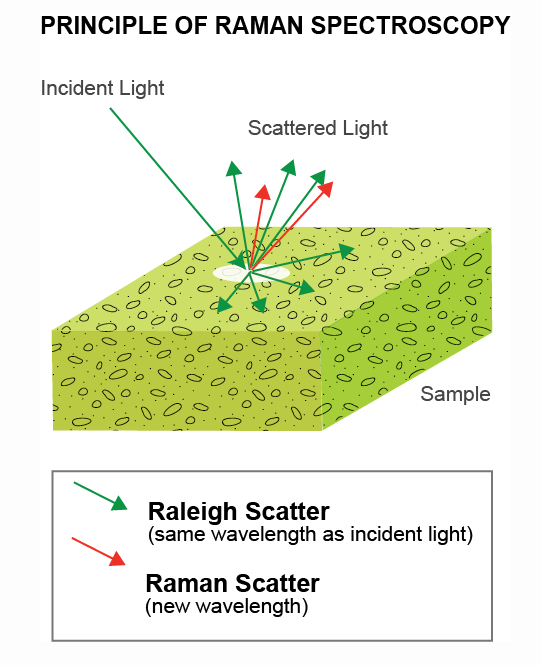
The Raman scattering process is typically very weak with most laser light being elastically scattered without change in energy. Elastic scattering is several orders of magnitude stronger (up to a million times or more) than the Raman signal.
Managing this background signal is crucial for all Raman spectroscopy measurements. Most setups use multiple optical filters to suppress this strong background and extract the Raman scattering signal.
Narrow bandpass laser line filters clean the incident light from secondary emission different from the main laser wavelength that could overlap with the Raman scattered light. The collected signal goes through a long pass or notch filter blocking the elastic scattering components while transmitting the Raman scattered light to the spectrograph and detector.
Raman spectra of biomolecules, cells and tissue
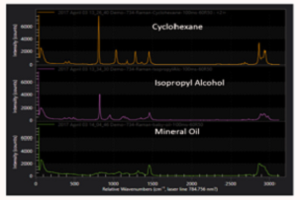
Raman spectroscopy produces a characteristic spectrum for different materials and biomolecules. Raman spectra contain a lot of information including:
- • The position and intensity of the Raman bands the spectrum comprises
- • The line width of the Raman bands
- • Energy shifts of the Raman band position as a function of chemical and physical environment parameters
The spectrum for a specific molecule can be used as a fingerprint for identification of the molecule with high specificity and sensitivity. This enables the detection of biomolecules and contaminants in cells and organisms, but also measurements of structural properties of molecules.
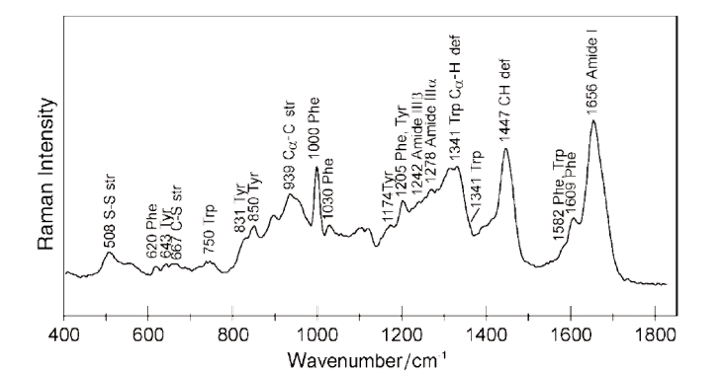
Consider the Raman spectrum of proteins as seen in Figure 2. The origin of the Raman bands can be traced back to specific functional molecular groups. Prominent Raman bands of proteins are related to the vibrations of amide groups in the backbone of the protein. A band around 1650 cm-1 is due to a C=O stretching vibrational mode, bands around 1550 cm-1 and 1300 cm-1 due to N-H bend and C-N stretch modes. Six additional normal modes with Raman response are associated with amide groups.
Amino acids such as phenylalanine, tryptophan and tyrosine contribute multiple additional Raman bands in the spectrum. In addition, the environment chemistry, temperature, chemical reaction and protein folding and unfolding can lead to changes of the intensity and position of Raman bands. The resulting Raman spectra are complex but encode a lot of information about the structure of the protein as well as its interaction within its environment in a simple optical measurement.
Raman spectra of cells include even more information as signals of proteins, nucleic acids, lipids and other molecules overlap. Raman spectroscopy has therefore become a valuable and proven tool in the characterization and investigation of cells and tissue and is used for applications such as:
- • Identification and classification of cells
- • Monitoring the content of proteins, lipids and nucleic acids in cells
- • Differentiation of stem cells
- • Observing effects and changes induced by drugs
Different organs and tissues in the body will have complex, but distinctive Raman signatures as the biochemical environment of cells and molecules changes.
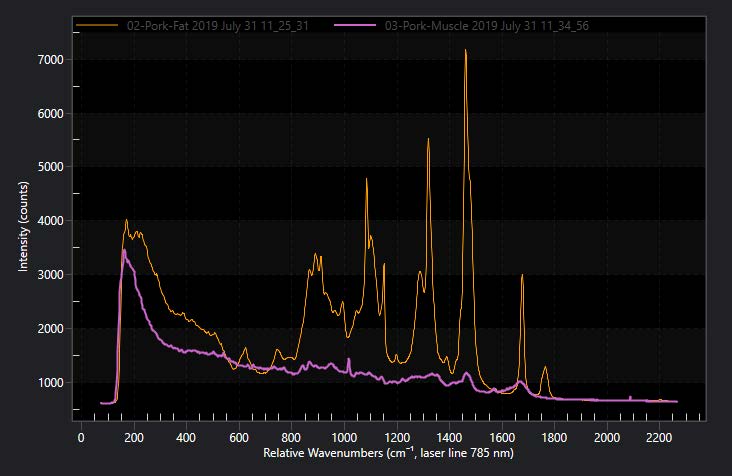
Figure 3 shows the Raman spectra of protein rich pork muscle tissue vs. lipid rich belly fat that clearly show different strength of Raman lines and background characteristics. However detailed analysis of these spectra to extract significant biological information requires advanced mathematical and statistical processing tools.
Impact of autofluorescence on biological Raman signals
Autofluorescence describes a broadband, natural emission in the blue/visible spectral range of biological tissue that is illuminated by an external light source without the addition of any fluorescence particles or markers. Different tissues can have different content of fluorescing molecules changing the strength and spectral shape. Autofluorescence is one of the major noise sources in Raman spectroscopy of biological tissue due to the weak nature of the Raman process.
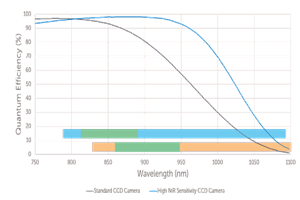
The influence of autofluorescence in Raman measurements can be mitigated by selecting different wavelengths of the excitation laser source. As the Raman shift is relative to the energy of the excitation light, the wavelength range of the Raman signal can be shifted into the NIR, a region with much less influence of fluorescence.
In addition, applications involving tissue and in vivo measurements have to carefully consider the wavelength and power of the laser to maximize signal, avoid damage of tissue (by heat or overexposure) and minimize attenuation in tissue (if subsurface measurements need to be made). Technology used for detection of the signal has to be sensitive at the signal wavelengths as well.
While autofluorescence is reduced for longer excitation wavelength, the efficiency and signal strength of the Raman scattering process decreases inverse to λ4 (where λ is wavelength). Visible excitation wavelengths have poor penetration into tissue and autofluorescence can strongly interfere with the Raman signal.
Laser wavelength at 785 nm or 830 nm are often chosen as they significantly reduce the interference from fluorescence signals and allow sensitive detection using silicon deep depletion sensors. While even longer excitation wavelength at 1064 nm are sometimes used to avoid autofluorescence they produce much less Raman scattered light and require much noisier InGaAs sensors for light detection.
Applications and measurement techniques of Raman spectroscopy in life science
Biosensing using sponaneous Raman spectroscopy
Biosensing focuses on the detection of specific analytes to monitor their concentration and functions in cells and tissues. Raman spectroscopy has long been identified as great tool for biosensing and offers key advantages for sensing on biological tissues and materials
- • Raman is compatible with any sample composition. Analyte concentrations in solvents can be analyzed, tissue, solids (composition of drugs for example)
- • No sample preparation or specific markers are needed (although they can be used in combination with Raman measurements)
- • In combination with microscopy, Raman can sense specific analytes on a subcellular level and measure their distribution in a cell
- • Raman can be easily combined with microfluidic devices to build more complex and automated analytical measurement setups
- • It is a non-invasive technique that can be used for subsurface sensing in tissue and in vivo measurements
Glucose sensing is one area where Raman spectroscopy is actively developed as analytical technique. Non-invasive, accurate, all optical measurement techniques for in vivo detection of glucose concentration would increase the comfort of millions of diabetes patients as it could replace the need for frequent, daily sampling of blood. Recently experiments have shown significant progress showing that characteristic glucose Raman fingerprint can be directly measured through skin and relates to the blood glucose concentration with high precision. The glucose Raman fingerprint and associate it with the blood glucose concentration measuring in vivo, directly through skin.
When used in the NIR wavelength range Raman spectroscopy can be used for measurements behind millimeter thick tissues and skull opening pathways for non-invasive optical spectroscopy to be applied for monitoring bio activity and processes in the brain. For example, Raman spectroscopy with excitation wavelength of 785 nm can be used to detect the concentration of various neurotransmitters on simulated brain tissue down to µM concentrations.
Especially challenging is that the weak Raman signals are reduced further during transmission through the skull to the detector. Surface enhanced Raman spectroscopy is a technique able to boost Raman signal levels by several orders of magnitude increasing the detection sensitivity of Raman measurements.
Raman enhancement: SERS
Surface enhanced Raman spectroscopy (SERS) describes the dramatic increase of Raman signal by molecules adsorbed onto metallic surfaces of nano-particles and nano-structures. Au and Ag are used most often for SERS measurements. The enhancement by as much as 14 orders of magnitude makes SERS sensitive to the presence of single molecules.
The origins of SERS are attributed to several factors, but mainly surface plasmon resonance due to the coupling of the incident light with the electrons in the metals lead to an electromagnetic enhancement of local electromagnetic fields.
SERS spectra do not necessarily increase the intensity of all Raman bands of a molecule and specific molecular vibrations can stop being Raman active due to changes in the molecular symmetry when being adsorbed on a surface. The magnitude of SERS is also sensitive to the kind of metal being used, size of particles as well as the laser excitation energy.
While Raman spectroscopy does not require use of molecular labels, SERS nanoparticle probes can be functionalized to target only specific molecules allowing for precise selection of bio markers, for example targeting detection of diseases.
Raman micro spectroscopy and imaging methods
In clinical research and diagnostics Raman spectroscopy is often combined with other experimental techniques to integrate and supplement its capabilities. In particular Raman:
• Microscopy: Raman spectroscopy is frequently combined with optical microscopy. Depending on the spatial resolution micro-Raman can localize the measurement region to sub cellular probe volumes around the diffraction limit. Confocal Raman spectroscopy uses an additional pinhole aperture to enable 3-dimensional sectioning greatly reducing background signals, from out of focus parts of the sample.
• Raman imaging: Raman spectroscopic imaging or hyperspectral imaging is sometimes used to spatially map the Raman signals within cells. Using automated translation stages Raman spectra are collected by moving the sample to expose different locations. Confocal microscopy has great spatial resolution and signal quality, however it is a slow process for Raman imaging as the sample must be scanned point by point often with relatively long dwell times due to the weak Raman signals. Faster implementations use scanning techniques such as push broom scanning where multiple points or regions of the sample are probed simultaneously. Using a good imaging quality spectrometer allows to acquire spectra from all probed regions in a single measurement.
• Tip enhanced Raman spectroscopy (TERS): TERS is a technique for probing surfaces with nm resolution and is closely related to SERS. A small, metallic tip of an atomic force microscope is scanned over a sample surface. As the tip is illuminated with the excitation laser electric fields are strongly enhanced in close vicinity to the tip enhancing the Raman signal. The spatial resolution of TERS is roughly determined by the diameter of the tip. It is extremely high reaching sub molecular resolution
Clinical in vivo applications of Raman spectroscopy
Raman spectroscopy is also gaining wider reach in clinical and surgical applications. These involve the detection of diseases and malignant tissue for cancer detection. Diseased tissue will undergo some changes in their biochemical composition.
Raman spectroscopy is able to detect and characterize the disease specific biomarkers that reveal changes compared to healthy tissue. For example lung cancer causes distinctive loss in lipids visible in specific Raman bands in the high wavenumber Raman spectrum around 2850 cm-1. Malignant breast tissue shows differences in Raman bands at 1150 cm-1 and 1520 cm-1 showing the presence of carotenoids in addition to spectral features indicating changes in lipids and fatty acids.
In vivo diagnostic results using Raman spectroscopy are available more quickly compared to conventional diagnostic methods that might require biopsies and lab analysis of samples. As a result, the application of Raman scattering tools promises a significant increase in patient comfort. It has been shown to identify malignant tissue of lungs, breast, digestive system, urinary tract, skin and brain.
Inflammation and cardiovascular disease have been successfully studied using Raman spectroscopy as well. Clogging of blood vessels, can lead to critical reduction in blood flow and needs to be tracked and characterized. Raman signals are sensitive to the lipids and calcium that are the main components of plaques found in coronary arteries. Experiments correlated the biochemical signature of plaques with their severity and stability providing additional information for risk management of the involved patients.
Raman spectroscopy can readily integrate in the surgical workflow, for example, to assess the success of cancer surgery or during routine endoscopic procedures and colonoscopies. Raman is currently making significant steps from research tool to routine clinical diagnostic device. Designing clinical Raman systems is complex as strict requirements for robustness of the equipment and sustainable ways of sterilization have to be implemented. Estimation of the involved risks like radiation exposure is necessary to adhere to strict regulatory requirements that also involve large clinical studies that must show the effectiveness of the instrument and procedures.
Sampling interface with novel fiber optic probes
Clinical in vivo Raman spectroscopy uses fiber optic probes to deliver excitation laser light to the target region in the body, collect the Raman scattering signal and deliver this signal to a sensitive spectroscopy system. Clinical Raman spectroscopy typically uses laser excitation wavelength at 785 nm or 830 nm, accomplishing a good compromise between minimization of autofluorescence, creating strong Raman signals, high thresholds for radiation induced damage and availability of compact and low-cost laser sources.
The use of fiber optics is necessary to provide the procedural flexibility to access arbitrary and sometimes confined spaces during surgery. Fiber optic tools can also be combined with other measurement modalities in endoscopic Instruments, such as OCT, reflectance and fluorescence. Some external imaging ability must be implemented in fiber optic Raman systems to reference the excitation volume to a precise location in the body.
Optical fibers (typically silica fibers) are chemically inert, very robust and affordable optical hardware. However, laser radiation will create strong background signal in fibers that needs to be managed. Design of fiber optic probes is carefully planned, and changes depending on the application and tissue type and must include filters so background from fibers does not reach the detector.
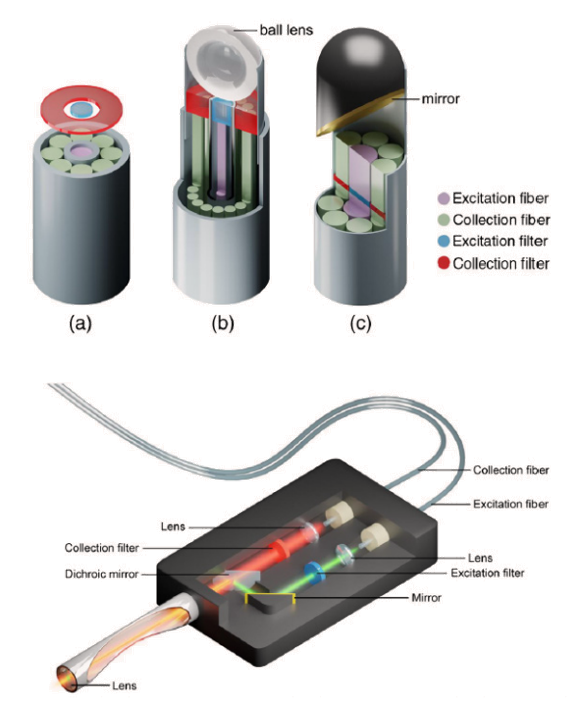
Frequently used designs are contact probes with fiber optic bundles. The excitation light is delivered by a single fiber which is surrounded by a ring of fibers to collect the scattered Raman light providing a large collection area for Raman signal. At the spectrometer the signal fibers are brought into a linear arrangement that can be placed along the entrance slit of a spectrometer increasing resolution with low coupling losses of signal. In this design optical filters excitation and signal are processed directly onto the end of the fibers.
Spatially Offset Raman Spectroscopy for Depth Resolved Measurements
Fiber optic systems used for in vivo Raman spectroscopy scrambles spatial image in the signal. Spatially offset Raman spectroscopy (SORS) uses properties of scattering in tissue to obtain information from distinct subsurface layers using fiber optic Raman probes allowing subsurface diagnostics, for example, for detection of a tumor buried under a layer of healthy tissue.
SORS measures Raman signals at increasing lateral displacement from the point of laser excitation. Due to the strong scattering in tissue, signal at larger displacement contains a larger contribution from deeper tissue layers. Spectra closer to the excitation region are dominated more by surface regions.
Careful computational analysis can retrieve the signal contributions from various subsurface layers. SORS relies on the distinct layered structure of the tissue as out of focus light is not rejected from the signal such as in confocal Raman spectroscopy. Though in suitable situations SORS can retrieve signals from great depth on the scale of centimeters.
Chemometrics, AI and ML in Raman data processing and anlaysis
Extracting relevant information from Raman spectra of biological systems can be a challenging task. The influence of a drug on tissue or presence of inflammation or disease might only be indicated by small spectral changes. Advanced data analysis tools therefore play an important role in biomedical applications of Raman spectroscopy.
The first data analysis step involves the elimination of fluorescent background from the signal. Often low order polynomial fitting is sufficient for this task as the broadband, fluorescent background varies slowly with changing wavelength compared to the sharper Raman bands. Background subtraction has to be carefully considered this step as small changes in procedure such as changing the polynomial order of the analysis can lead to strong changes in the Raman spectrum.
Other computational techniques for background subtraction involve differentiation and Fourier transform based frequency filtering. Hardware based techniques such as shifted excitation spectroscopy (shifting the Raman signal while the fluorescent background remains stationary) can be useful but add complexity to the experiment.
Sometimes data analysis considering only the position and intensity of a few identifiable peaks in the Raman spectrum is sufficient, but often the biochemical complexity requires to take all information in the spectrum into account. Advanced data analysis uses multivariate and statistical tools, chemometrics, statistical analysis and/or machine learning/AI systems.
Principal component analysis (PCA) reduces the dimensionality of the data and recovers underlying structure in the data for qualitative and quantitative analysis. Regression using partial least squares (PLS) fitting using model spectra is another common technique for obtaining concentrations of target molecules and their contribution to the Raman spectrum.
Summary
Raman spectroscopy is a valuable tool for that is applied at all stages in life science research from studying fundamental properties of proteins, sensing biomolecules in vitro and in vivo to clinical detection of tumors. It will continue to be an indispensable tool in fundamental research as well as increase its footprint in clinical settings due to its many useful applications in disease diagnostics.
References
- • Moody et al, Surface Enhanced Spatially Offset Raman Spectroscopy Detection of Neurochemicals Through the Skull, Analytical Chemistry 89, 5688 (2017)
- • Cordero et al, In vivo Raman spectroscopy: from basics to applications, Journal of Biomedical Optics 23, 071210 (2018)
- • Pence et al, Clinical Instrumentation and application of Raman spectroscopy, Chem Soc Rev 45, 1958 (2016)
- • Movasaghi et al, Raman Spectroscopy of Biological Tissues, Applied Spectroscopy Reviews 42, 493 (2007)
- • Kang et al, Direct Observation of glucose fingerprint using in vivo Raman spectroscopy, Science Advances 6, eaay5206 (2020)
Further Reading
Introduction to Raman Spectroscopy
Introduction into how Raman spectroscopy occurs, what it can be used to measure, and how it can be used within internal and environmental sensing.
Deep Depleted Cameras for In vivo Raman
Raman spectroscopy is an important technique for life sciences, however it is a weak effect and requires highly sensitive cameras that can detect very low signals.
Related Raman Products
Raman spectroscopy can be implemented in various ways dependent on the sample being studied. Therefore it is important to use the correct equipment. Find out more about your options here.