
Abstract
A novel astigmatism-free spectrograph design, the Princeton Instruments SCT 320 IsoPlane Schmidt-Czerny-Turner (SCT) spectrograph, is shown to give Raman spectra with better resolution and signal-to-noise ratios than traditional Czerny-Turner (CT) spectrographs. A single-stage SCT spectrograph has been interfaced to a new low-frequency Raman spectroscopy module that uses volume phase holographic gratings as Rayleigh line filters. The system has been used to measure the low-frequency Raman spectra of several crystalline amino acids. A spectrum of l-cystine shows that peaks as close as 10 cm-1 to the Rayleigh line are measureable. The spectra show complex patterns of peaks that can be used to easily distinguish the acids from each other, resulting in what may best be called a “second fingerprint region.” While useful for low-frequency Raman work, the system described here is useful for examining higher-frequency modes of samples as well.
Introduction
The Czerny-Turner (CT) spectrograph has been used to measure Raman spectra of samples for decades.1,2 Inherent in the design of CT spectrographs are optical aberrations, including astigmatism, coma, and spherical aberration.3 Astigmatism occurs when mirrors are used to focus a source off axis, giving distorted images and spectral peaks that are broadened, thus degrading spectral resolution. Coma occurs when mirrors are used to image a source off axis, and gives rise to images with a comet-like tail and spectra with asymmetrically broadened peaks. Spherical aberration is caused by using spherical mirrors to focus an image and causes a symmetrical blur in images and broadening in spectra. These optical aberrations are a result of the laws of physics and are present in CT spectrographs regardless of their manufacturer.
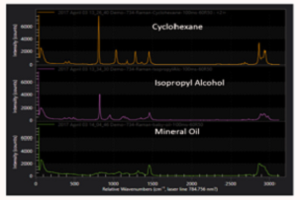
The net result of the astigmatism, coma, and spherical aberration inherent in the CT design are Raman peaks of poor quality. The 802 cm-1 Raman shift peak of cyclohexane measured with a CT spectrograph seen in Figure 1 has an asymmetric lineshape, is broadened so it has degraded spectral resolution, and is short, thus lowering the signal-to-noise ratio (SNR).
In response to the problems with the CT spectrograph, Princeton Instruments has developed the Schmidt-Czerny-Turner (SCT) spectrograph, or IsoPlane® SCT 320 spectrograph. Compared to the CT design, the SCT spectrograph has zero astigmatism at all wavelengths across the entire focal plane, as well as reduced levels of coma and spherical aberration. Figure 1 shows a comparison of the 802 cm-1 Raman shift peak of cyclohexane measured with CT and SCT spectrographs. The SCT peak has a symmetric shape, is narrower than the CT peak and thus has better spectral resolution, and is taller, resulting in better SNR. By reducing optical aberrations, the SCT spectrograph gives Raman spectra with better resolution and SNR than CT spectrographs.

Low-frequency (10–200 cm-1) Raman bands provide information on lattice modes in solids, can be used to distinguish active pharmaceutical ingredient polymorphs,4 provide information about the metal ions in inorganic and organometallic compounds, and are used to determine the diameter of carbon nanotubes from the peak position of the radial breathing mode.5
Traditionally, triple monochromators were needed to reject the Rayleigh line allowing low frequency Raman spectra to be measured. A new low-frequency Raman analysis system, the XLF-CLM from Ondax, uses volume phase holographic gratings acting as ultra-narrow notch Rayleigh line filters. This system rejects enough elastically scattered photons to allow bands as close as 10 cm-1 to the Rayleigh line to be observed using only a single-stage spectrograph. This gives a low frequency Raman system that is light, easy to use, and reasonably priced.
The limitations of this system are that it can only work with one excitation wavelength, in this case 785 nm. Also, because of the volume phase holographic gratings used, this system will not work in the ultraviolet. Thus triple monochromators are still useful for researchers using multiple laser excitation lines, who have tunable laser systems, or who work in the ultraviolet. Also, since a triple monochromator contains three spectrographs it can produce spectra at higher resolution than the system described herein whose resolution is limited by using only one spectrograph.
The XLF-CLM low-frequency Raman front end has been interfaced with a Schmidt-Czerny-Turner spectrograph to produce quality low frequency Raman spectra. The low-frequency Raman spectra of several amino acids have been measured with this system. Surprisingly unique and complex patterns of peaks were observed, making the 10–200 cm-1 region of these spectra a “second fingerprint region.” It is possible that this wavenumber region could be very useful in distinguishing compounds of similar chemical structure.
Experimental
The amino acids analyzed were cystine, glutamic acid, cysteine, histidine, methionine, tryptophan, phenylalanine, and tyrosine. The amino acids were purchased as crystalline solids from Sigma-Aldrich (St. Louis, MO) and used as is. In all cases the L-isomers were analyzed. The samples were contained in glass vials with screw-on caps. The vials had a reproducible but small fluorescence spectrum that was subtracted from sample spectra prior to data workup.
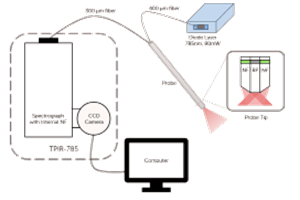
The XLF-CLM low-frequency Raman analysis system from Ondax (Monrovia, CA) was used to measure low-frequency Raman spectra. This module contains a sample holder, focusing objective, 785 nm Ondax SureLock™ laser, amplified spontaneous emission filters, a neutral density filter, and Ondax SureBlock™ proprietary, solid-glass, volume holographic gratings with an optical density >8. Light was collected in a 180° back-scattering mode. Laser powers of ~50 mW were used. Light from the Ondax system was coupled to the spectrograph via a single-core 25 μm diameter optical fiber.
The spectrograph used was a Princeton Instruments (Trenton, NJ) IsoPlane SCT 320 Schmidt-Czerny-Turner spectrograph. This spectrograph has a focal length of 320 mm and was equipped with a 600 groove/mm grating blazed at 500 nm. The wavelength axis of the IntelliCal® wavelength calibration system. The accuracy of the wavelength calibration was 0.01 nm. The calibration was checked by taking the low-frequency Raman spectrum of sulfur and comparing it to the literature.8 The measured and literature peak positions for eight sulfur peaks between 20 and 220 cm-1 agreed with a standard deviation of 0.57 cm-1. Comparison of five peaks measured in the spectrum of L-cystine to literature values4 produced a standard deviation of 0.29 cm-1. Stokes and anti-Stokes spectra were measured.
The camera used was a Princeton Instruments PIXIS:400BRX back-illuminated deep-depletion sensor with eXcelon®. The CCD was cooled to -70°C. A region of interest 15 rows tall in the center of the chip was defined and all rows in this region were vertically binned. Sensor rows outside of this region were found to contain negligible signal counts. Equipment was controlled and data collected using Princeton Instruments LightField® software v4.5. Data were processed and displayed using GRAMS v9.1 software from Thermo Fisher Scientific (Waltham, MA).
Results and Discussion
Frequently Raman spectra are measured with shifts from 4000 to 200 cm-1. Peaks closer to the Rayleigh line are difficult to see because of the large size and width of this peak. Triple monochromators6 can reject most Rayleigh scattering photons and allow low-frequency Raman shifts to be seen. However, these systems are large and expensive. As a result, Raman shifts from 10 to 200 cm-1 are not as routinely measured as higher-frequency Raman peaks.
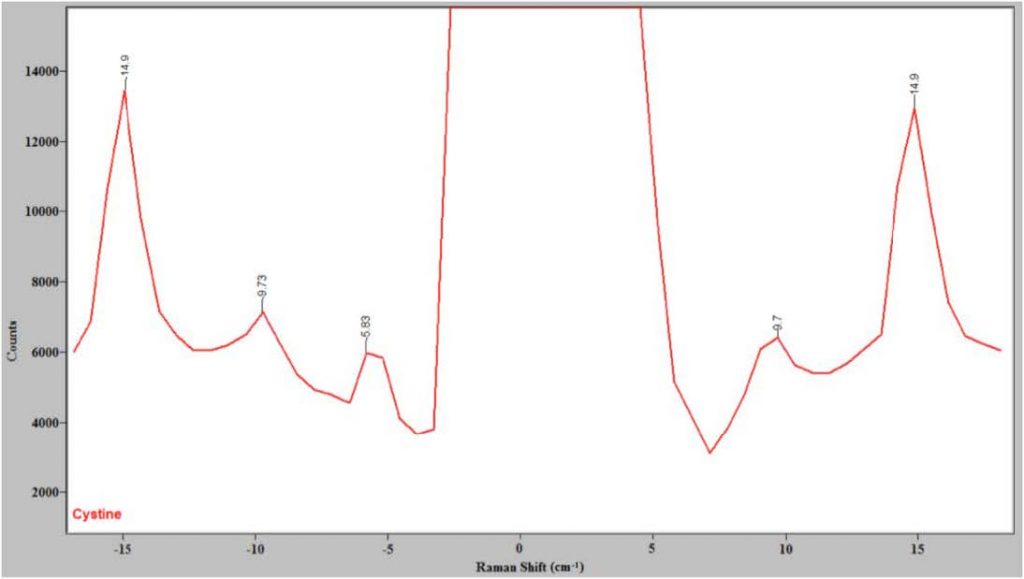
The spectrum of L-cystine is an excellent test of the ability of a Raman system to get close to the Rayleigh line since it has known peaks at 5 and 10 cm-1.4,6 Figure 2 shows the spectrum of cystine close to the Rayleigh line measured with the Ondax low-frequency Raman front end and the Princeton Instruments IsoPlane spectrograph. Note that there are Stokes and anti-Stokes peaks at 9.7 cm-1, confirming that this system can get as close as 10 cm-1 away from the Rayleigh line. Figure 2 shows that the volume holographic gratings in the present system do an excellent job of rejecting the Rayleigh line, meaning now only a single-stage spectrograph is needed to obtain low-frequency Raman spectra.
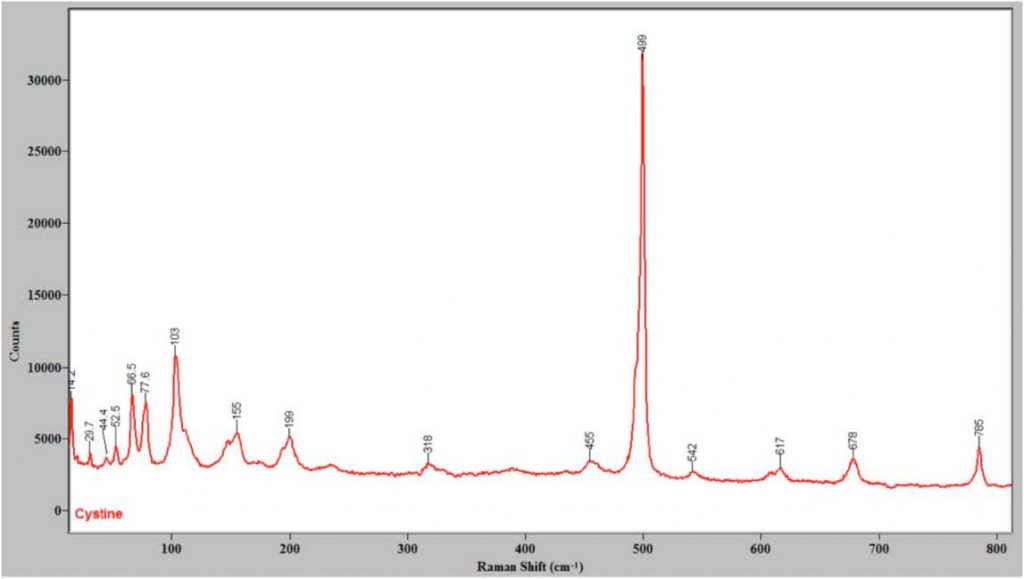
Although this system provides low frequency Raman spectra, the use of coarse gratings and adjusting the center wavelength allows low-frequency and higher-frequency peaks to be observed at the same time, as seen in Figure 3, which shows the Raman spectrum of cystine from 15 to 800 cm-1.
The vibrations sampled at Raman shifts greater than 200 cm-1 typically involve individual functional groups or single molecules that are best characterized as internal or intramolecular modes. Below 200 cm-1, modes involving groups of molecules are seen. Frequently these vibrations involve frustrated translations or rotations (librations) of one or more molecules. These types of vibrations are referred to as external or intermolecular modes,8 and in the case of the lattice modes of solids the vibrations are known as phonons and can involve movement of unit cell(s). Lattice modes for organic crystals frequently fall below 130 cm-1. 8 Molecules with aromatic rings frequently have a series of features in this region, and have intense low- frequency Raman peaks in general.8
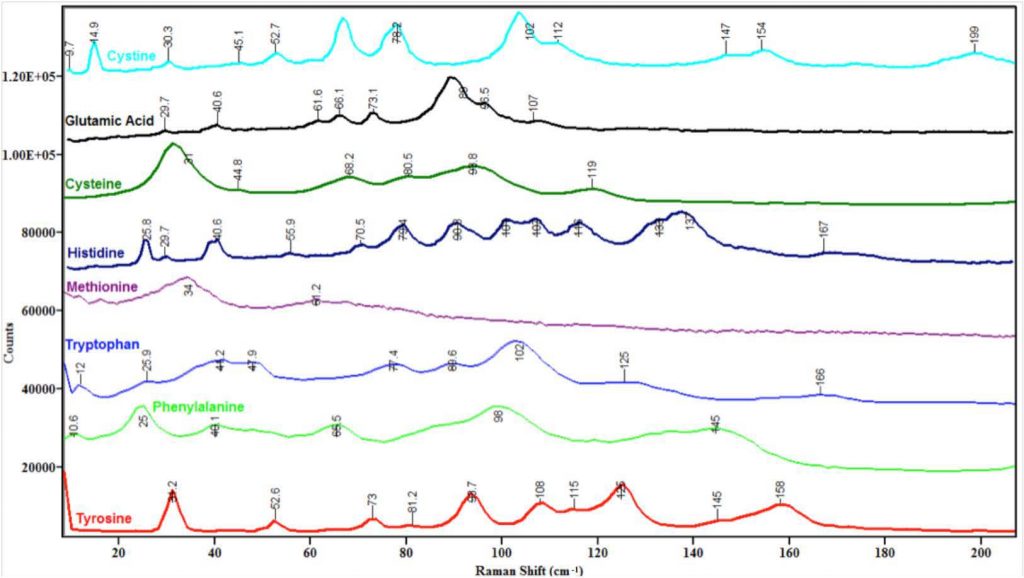
Note that the busiest region in the spectra in Figure 4 is between 50 and 150 cm-1. One possible explanation for this observation is that in this region the energies of external and internal modes overlap, leading to vibrational interactions such as Fermi resonances that add peaks to the spectra and thus complicate their appearance. The region below 50 cm-1 is not as complex because perhaps only lattice modes fall at this low energy. The 150–200 cm-1 region is relatively quiet, perhaps because mostly internal modes fall in this regime and many amino acids may not have vibrations at this low energy.
A detailed discussion of each spectrum in Figure 4 and its comparison to known literature values is contained in an upcoming publication.9
Conclusions
A Schmidt-Czerny-Turner spectrograph was mated to a low-frequency Raman scattering module containing a laser, sample holder, amplified stimulated emission filters, and volume phase holographic gratings to filter out the Rayleigh line. The system was used to study the low-frequency Raman scattering spectra of several crystalline amino acids. The spectrum of L-cystine has a known peak at 10 cm-1 that was observed by this system, indicating it is capable of seeing peaks as close as 10 cm-1 to the Rayleigh line. Spectra of the amino acids between 10 and 200 cm-1 show complicated patterns of intense peaks unique to each compound from what are probably lattice modes, low-frequency internal modes, and their interaction. The level of detail in this region justifies calling it the “second fingerprint region.”
References
- M. Czerny and F. Turner, Z. Physik 61 (1930) 792.
- J.M. Hollas, Modern Spectroscopy, 3rd Ed., Wiley, New York, 1996.
- J. Reader, J. Opt. Soc. Am. 59 (1989) 1189.
- J. Carriere, R. Heyler, and B. Smith, “Polymorph Identification and Analysis using Ultralow-Frequency Raman Spectroscopy”, Spectroscopy, June Supplement, 2013, 44–50.
- M.S. Dresselhaus, G. Dresselhaus, A. Jorio, A.G. Souza Filho, and R. Saito, “Raman spectroscopy on isolated single wall carbon nanotubes,” Carbon, 40, 2043 (2002).
- R. Shäfer, O. Rohm, M.Neglia, D. Koulikov, and A. O’Grady, “Low-Frequency and Stokes-AntiStokes Raman Measurements Using a Triple-Spectrometer System,” Spectroscopy, June Supplement, 2006, 33–34. B.C. Smith, unpublished results.
- J. Carriere and F. Havermeyer, Proceedings SPIE, Biomedical Vibrational Spectroscopy V: Advances in Research and Industry, 821905 (February 9, 2012).
- P. Larkin, M. Dabros, B. Sarsfield, E. Chan, J. Carriere, and B.C. Smith, in preparation.
- Brian C. Smith and J. Carriere, Biomedical Spectroscopy and Imaging, submitted
Further Reading
Introduction to Raman Spectroscopy
Introduction into how Raman spectroscopy occurs, what it can be used to measure, and how it can be used within internal and environmental sensing.
Ultra-Multiplex CARS Spectroscopic Imaging of Living Cells
Ultra-multiplex CARS spectroscopic imaging is able to provide non-invasive, real-time, cellular-level molecular diagnostics for both experimental and clinical applications.
Using Raman Spectroscopy to Detect Malignant Changes in Tissues
Summary of the work done at Vanderbilt University, in which a Raman spectroscopy system was used to non-invasively detected malignant tissue.