
Overview
Animal studies contribute significantly to our understanding of human disease, and function as an established and essential step in the development of treatments and other therapeutic agents. These studies are conducted in the preclinical phase, preceding drug screening in human clinical trials. The aim of these studies is to determine efficacy, safety, dosing, and toxicity, as well as risk-benefit trades. There are many established, standardized methods implementing animal studies in life science and chemical analysis.
There are three broad life science experimental categories: in vitro, ex vivo, and in vivo. In vitro testing studies biological matter (cells or tissues) outside of a living organism, with experiments typically employed in a Petri dish. The benefit of in vitro studies is that they provide cellular and molecular analysis, alongside development of cell lines for future studies.
However, its biggest limitation is the inability to replicate the naturally occurring environment of the organism. To combat this, there is ongoing development in in vitro techniques, such as organoid and organ-on-a-chip, that show promise in their ability to compliment, and in some cases supersede, cell cultures and animal model testing.
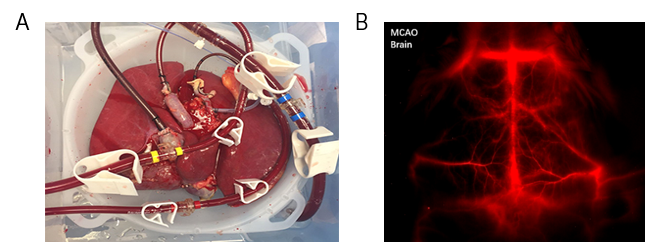
By contrast, ex vivo is used to study specific organ and tissue function removed from other bodily stimuli, conducted under controlled conditions. This process works by artificially mimicking body function outside of an organism while studying an extracted organ/tissue of interest, as shown in Figure 1A.
If there is evidence that the experimental strategy works in in vitro/ex vivo experiments, studies may progress to in vivo experiments to gather additional information and verification. In vivo experiments employ a whole, living organism as opposed to ex vivo tissue or in vitro controlled, cellular based experiments.
Animal testing and clinical trials are two forms of in vivo research. In vivo testing is often required alongside in vitro to observe the effects of an experimental process throughout an entire organism. Mice, rabbits, guinea pigs and monkeys (non-human primates) are common animals used to evaluate potential treatments in preclinical in vivo experiments, as shown in Figure 1B. In vivo imaging is therefore essential to determine the path forward in critical life science research.
Advances in non-invasive in vivo imaging techniques have enabled the effective use of animal models in increasing numbers of preclinical drug research and development programs. These advances have also enabled researchers to conduct long-term longitudinal experiments, increasing the understanding of animal models and decreasing the time to reach quantitative assessments. This has the further advantage of reducing the number of animal specimens required to complete an in vivo study.
Imaging Modalities
There are several imaging modalities that are well established for small animal in vivo imaging: optical imaging (OI), magnetic resonance imaging (MRI), computed tomography (CT), micro-computed tomography (μCT), singlephoton emission tomography (SPECT), scanning electron microscope (SEM), ultrasound (US), and positron-emission tomography (PET).
To a large extent, these different modalities are complementary, rather than competitive. To promote the complimentary approach, some suppliers implement multiple modalities within the same instrument, with others providing ease of sample transfer between different imaging modalities. For example, the combination of OI and µCT imaging has been implemented in a number of commercially available in vivo imaging systems
Optical Imaging
Optical imaging (OI) was first used preclinically over two decades ago with the introduction of in vivo imaging. OI is advantageous as it is non-invasive, allowing for live imaging of animals. This allows the technique to deliver fast, longitudinal, accurate, real-time and quantitative assessments of drug efficacy.
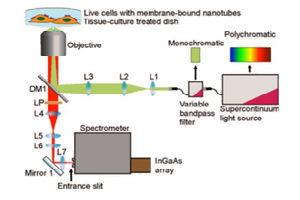
A typical small animal in vivo imaging system consists of a “dark box”, which encases the camera, optics, and the animal subjects. The number of animals being imaged within a dark box varies from single subjects up to as many as ten. Also, inside the dark box is a collection of accessories, such as an anesthesia manifold and animal tray, which contribute to the experimental set-up. In addition to the equipment is the system electronics and typically a camera chiller, separated from the main “dark box” [1].
OI is a technique that utilizes the difference in optical scattering properties of individual tissues for image formation. Different OI imaging techniques provide complementary information regarding structure, metabolism, and physiology of an animal. Information provided by the individual techniques can be synergized by an image registration mechanism, which combines the images obtained from each technique.
Bioluminescence imaging (BLI) and fluorescence imaging (FLI) are the predominant imaging techniques used in OI. BLI is the result of an enzymatic reaction, with FLI occurring when incident light of one wavelength is absorbed by a fluorescent probe, and then emitted with a different (usually longer) wavelength. This means that FLI requires a light source to excite a fluorescent molecule (fluorophore), which then emits photons creating an image [2]. Comparatively, BLI uses light-emitting proteins (luciferases) found naturally in insects, bacteria, and plants for cell labeling in vivo [3].
Although not directly translational to the clinic, these techniques have become the primary resource for imaging of small animals in the research environment, due to their ease of use, flexibility, inexpensive nature and the capability for rapid image collection. These techniques are also advantageous as some of the models and assays developed prior to preclinical studies, within tissue culture, can be directly transferred into small animals. The main animal model used for whole animal molecular OI is the mouse, with “murine” studies performed as standard. Rat imaging is also feasible, alongside studies of larger animals (such as rabbit or non-human primate) via superficial imaging.
Optical imaging has advanced as a modality due to more sensitive cameras, greater processing power and data storage capacity, alongside more sophisticated algorithms. Correlating with other imaging modalities has become simpler, and in some cases, seamless through the use of common equipment, or via shuttles between instruments that allow for coregistration of fiducial markings. This allows complementary data to be garnered from the same animals simultaneously or over time [1]
Interaction of Wavelengths within Biological Tissue
In vivo applications, especially those which use fluorophores, must consider the properties of the excitation light source to prevent unwanted tissue damage. For example, deep blue or ultraviolet (UV) can result in tissue trauma, whereas excitation in the infrared (IR) can cause tissue heating.
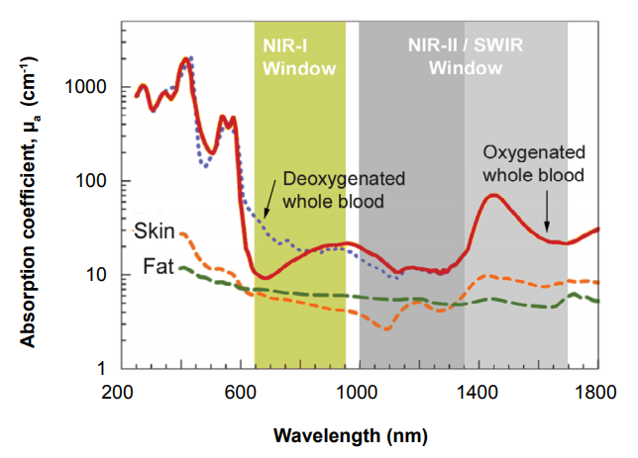
Another issue is that certain wavelengths penetrate tissue poorly, with visible blue/green wavelengths having low penetration depth, limiting their use to very small animals or surface imaging [4]. Alongside this consideration, components within the animal, such as hemoglobin and related molecules, naturally fluoresce in the visible blue/green range. This is known as tissue autofluorescence. Therefore, the optimal excitation wavelength of most conventional fluorophores is in the deep red or near infrared range, commonly referred to as NIR-I window, due to adequate tissue penetration and low tissue autofluorescence. Figure 2 below shows spectroscopic characterized blood and tissue based on differences in the optical absorption and scattering properties.
Different wavelengths scatter and penetrate tissue differently due to the scattering coefficient of each tissue type. The degree of scattering within biological tissue (μ’s (λ)) is described by the function:
μ’s (λ)=αλ-ω
with α relating to the concentration of scattering centers in tissue and the ratio between the refraction of the surrounding medium and the refraction of the scattering. ω is the wave exponent, and relates to the behavior of the scattering coefficient of the tissue, with a value usually between 0.2 ~ 4 in biological tissue, and λ relates to the wavelength of incident light [5,6].
Therefore, the longer the wavelength used, the less scattering occurs with deeper penetration into the tissue. Wavelengths within the NIR-I window (760-900 nm) are advantageous as they are poorly absorbed by water and hemoglobin within the tissue, unlike the visible range. This causes the tissue to become transparent (as it is predominately comprised of water and hemoglobin) allowing for NIR-I fluorophores to be detected deep within the tissue. However, these excitation wavelengths also cause autofluorescence within biological tissue, contaminating data acquisition [7]. In vivo imaging within the NIR-II wavelength range has further advantages. As the NIR-II wavelength window encompasses longer wavelengths (1000-1700 nm) there is less scattering within the biological tissue.
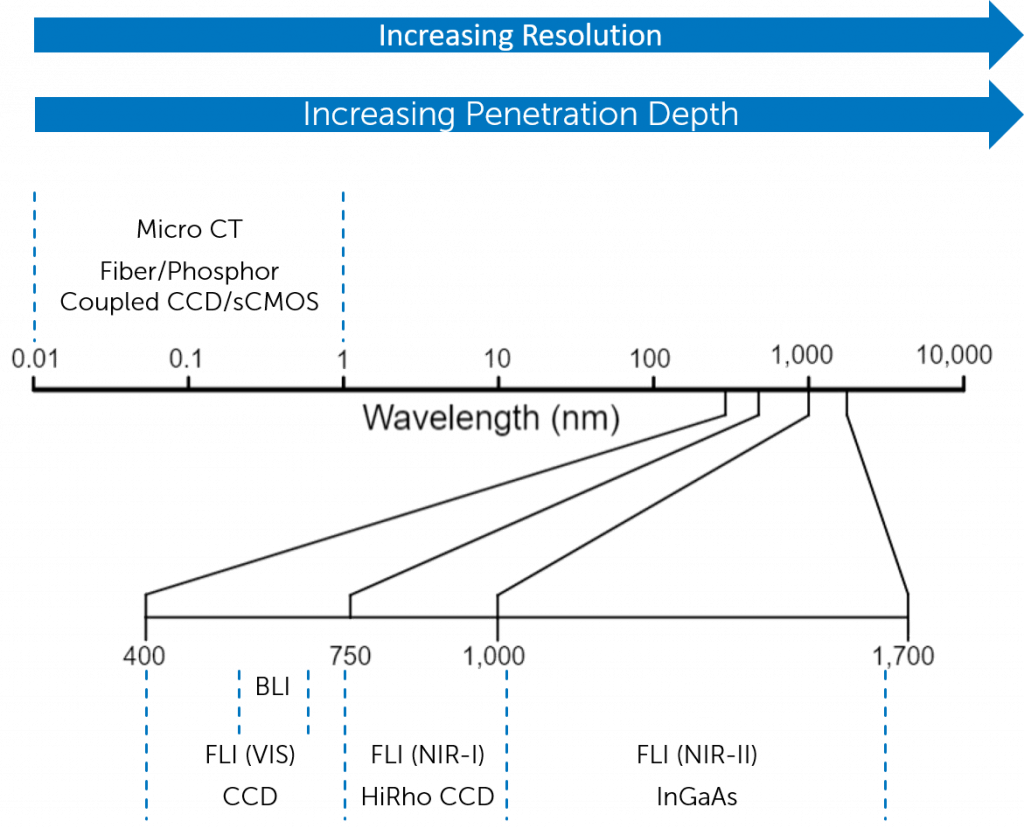
Although there is increased absorption from various biological tissues, the reduced scattering alongside a reduction in tissue autofluorescence contributes to higher spatial resolution than NIR-I imaging. Both these wavelength windows require either a HiRho CCD sensor or an InGaAs sensor dependent on wavelength range and resolution required. Figure 3 shows multiple imaging modalities and the imaging parameters they are able to achieve in vivo.
Imaging Parameters and Performance
There are a number of imaging parameters that drive effective image acquisition, primarily detector sensitivity, spatial and temporal resolution, and cumulative noise. Most high-performance in vivo imaging systems use either a charge coupled device (CCD) or an InGaAs 2-D array detector, dependent on the wavelength of the signal being emitted. Specifics of these parameters can be seen in Table 1. Usually in vivo fluorophores produce a faint signal, due to the requirement for longer exposure, detectors with low noise are required. Therefore, most in vivo imaging systems employ deeply cooled cameras [8].
| Specifications | InGaAs FPA | Si-CCD |
|---|---|---|
| Typical Pixel Size | 12 – 25 μm | 9 – 15 μm |
| Typical Resolution | 320 x 240 to 640 x 512 | 512 x 512 to 2048 x 2048 |
| Wavelength Response (nm) | 900 – 1700 | 200 – 1100 |
| Typical Dark Current @ -80C (e-/pixel/sec) | 100 | 0.001 |
| Frame Rate (fps) | 100 – 250 | 1 – 4 |
Detector Sensitivity
Sensitivity can be defined as the “photon capture” capability of the system. Quantum efficiency (QE) is a function of the quantitative ability of the system to convert photons to electrons, producing a digital image. System QE is often simplified to describe only the QE of the camera detector, however detector QE, combined with the transmission of optics and filters, will determine the percentage of signal collected by the system.
Sensitivity is also impacted by the wavelength of the photons emitted, with each detector having an optimal QE that corresponds to a specific wavelength range. CCD detectors are sensitive between 350 and 1000 nanometers (nm), although QE for standard silicon CCD detectors drops drastically from 800 nm. Typical CCD detectors have peak QE in the mid-visible range.
Therefore, most in vivo systems require a back thinned, or back-side illuminated (BSI) CCD. This fabrication method increases the absorption of photons resulting in a much higher QE than a front-side illuminated CCD. InGaAs detectors typically cover the wavelength range 900 – 1700 nm, with some reaching as far as 2.5 micron. This range is referred to as short wave infrared, or SWIR, and encompasses the NIR-II window. Fluorescence imaging in the short-wave infrared (SWIR) regime is generating substantial interest in the biomedical community as explained above.
Typical QE of CCD and InGaAs detectors is shown in Figure 4. Detectors fabricated with high resistivity bulk silicon (HiRho) have higher QE in the near infrared and produce less fringing pattern in the image. Fringing is caused by the constructive interference of monochromatic light when reflected within the CCD sensor. These detectors provide imaging capability from 900-1050 nm, in the otherwise limited performance ranges of CCD and InGaAs. This sensitivity corresponds to the NIR-I window. InGaAs detectors have very consistent QE across the range from 1000 nm to 1600 nm.

Spatial Resolution
Spatial resolution is the smallest object that a sensor can resolve. The sample structure and emission intensity determine the spatial resolution required for accurate data acquisition, with sensor size also playing a factor. Sensor size and optics are important as they establish the field-of-view and the total signal collected from the sample. These parameters are impacted by the performance, economics and current availability of cameras and optics. Pixel count is also a factor as it will generally determine feature resolution. Smaller pixels allow for higher resolution, but at the cost of lower dynamic range as they are collecting less signal for a given noise level than a larger pixel would. A way to combat this limitation is through pixel binning, in which signal from multiple pixels are cumulatively added into a single pixel. This increases sensitivity but decreases resolution.
Detectors can have a wide range of resolutions. Taking a CCD detector as an example, spatial resolution can be 320 x 240 to as large as 16 megapixel. In optical in vivo systems, typical CCD formats range in resolution from 512 x 512 up to 2048 x 2048. This resolution is achievable through pixel sizes typically between 10 – 15 μm. These pixels accumulate to create a large pixel array size of approximately 30 x 30 mm. Three of the most common detectors used in in vivo OI applications are manufactured by Teledyne e2v, shown in Table 2. These detectors have typical in vivo detector characteristics, including spatial resolution, low noise and high sensitivity.
| Product | CCD47-10 | CCD42-40 | CCD230-42 |
|---|---|---|---|
| Pixel Pitch (μm) | 13 | 13.5 | 15 |
| Format | 1024 x 1024 | 2048 x 2048 | 2048 x 2048 |
| Image Area (mm) | 13.3 x 13.3 | 27.6 x 27.6 | 30.7 x 30.7 |
| Full Well Capacity (ke-) | 120 | 100 | 150 |
| Readout Noise (e-) | 4 | 3 | 4 |
| Peak QE (%) | 85 | 95 | 97 |
Noise Reduction Via Cooling
Low-light imaging and spectroscopy applications, such as in vivo imaging, rely on highly sensitive silicon or InGaAs scientific detectors. To ensure high sensitivity, it is necessary to cool the cameras to minimize thermally generated noise. By cooling the system, to often between -60oC and -100oC, and reducing noise, integration times can range from several minutes to multiple hours. For example, dark current is thermal noise generated by the camera in absence of light. By using a vacuum seal to ensure cooling of the system, this background noise is significantly reduced.
Another example is readout noise, generated by the camera electronics such as the output amplifier. This noise is the limiting factor for low light images. By cooling the CCD, the transfer rate will become slower while increasing the charge transfer efficiency, overall reducing the readout noise. In InGaAs cameras, dark current can be as significant as readout noise, often being the limiting factor in low light applications. As well as dark current, InGaAs cameras are also impacted by ambient background radiation. For this reason, InGaAs cameras must cool the sensor as well as the optical path to reduce these noise contributions.
Although a number of cooling technologies (e.g., thermoelectric, cryogenic, Joule-Thomson) have been used in scientific cameras over the years, thermoelectric (TEC), otherwise known as Peltier cooling, has proven to be the most attractive due to its maintenance-free and reliable operation. Achieving the deepest cooling using a TEC requires multiple parameters, such as an ultra-high vacuum (UHV) environment around the sensor, non-outgassing materials, no epoxies, and permanent, all-metal, hermetic seals. To maximize light throughput, a single-window vacuum design is best. This design ensures that the vacuum window is the only optical surface encountered by incident photons before they reach the detection surface.
However, each uncoated optical surface of the vacuum window can have up to 4% transmission loss. When imaging in low-light applications, this loss can result in a significant reduction of signal-to-noise ratio. Moreover, any light reflected inside the system can lead to glare and fringing, especially when used with coherent illumination. To solve this limitation, anti-reflective (AR) coatings are applied to the window in the optical path.
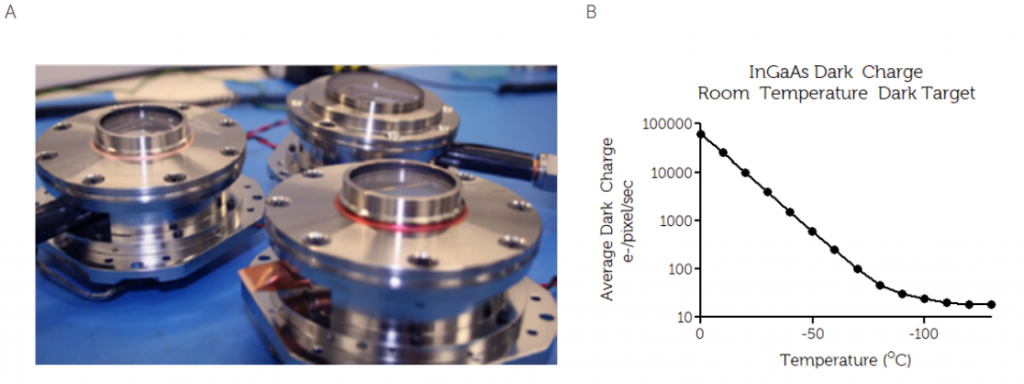
This results in a reduction of transmission loss to <1%, with some coatings achieving <0.5%. To optimize the design, an efficient heat exchanger should be incorporated. The heat exchanger allows for high thermal dissipation, alongside intelligent controls to achieve high reliability and temperature stability. The figure below shows a typical high-performance vacuum assembly, and the positive effect of CCD cooling on dark current noise.
Summary
In vivo imaging is an essential part of therapeutic agent development, providing the key preclinical data for determining success rate of human clinical trials. Whole animal imaging heavily relies on fluorophores introduced into the system to measure the effectiveness of a potential agent, alongside efficacy, safety, dosing and toxicity.
Limitations of in vivo imaging relate to spatial resolution, wavelength penetration depth and autofluorescence of biological tissue. Fluorophores within the NIR-I and NIR-II window have been developed to reduce these limitations. NIR-I/-II fluorophores increase spatial resolution through reduced tissue scattering, reduced tissue absorbance and reduced tissue autofluorescence.
Fluorophores within the visible range are still commonly used for in vivo imaging, as there are multiple, medically approved fluorophores within this range that are low in toxicity, available for clinical use. For visible range fluorophores, CCD sensors are commonly used for optical imaging, with NIR-I/-II fluorophores requiring either HiRho CCD or InGaAs sensors. These sensors have high QE from 750 – 1050 nm and 1000 – 1600 nm respectively, so are optimal for NIR-I/-II imaging. To ensure the lowest possible noise, these sensors need to be deeply cooled, especially within low-light imaging typical of in vivo experiments.
References
- Recent Developments in Small Animal Imaging, Josh P. Roberts, February 20, 2020. https://www.biocompare.com/Editorial-Articles/560606-Recent-Developments-in-Small-Animal-Imaging/
- Studwell, Anna J, and Darrell N Kotton. “A shift from cell cultures to creatures: in vivo imaging of small animals in experimental regenerative medicine.” Molecular therapy : the journal of the American Society of Gene Therapy vol. 19,11 (2011): 1933-41. doi:10.1038/mt.2011.19
- Yanping Sun, Herbert B. Newton, Chapter 36 – Neuroimaging of Brain Tumors in Animal Models of Central Nervous System Cancer, Editor(s): Herbert B. Newton, Handbook of Neuro-Oncology Neuroimaging (Second Edition), Academic Press, 2016
- New Strategies for Fluorescent Probe Design in Medical Diagnostic Imaging Hisataka Kobayashi*†, Mikako Ogawa†, Raphael Alford†, Peter L. Choyke†, and Yasuteru Urano‡ Chemical Review, 2010, 110, 5, 2620–2640, Publication Date: December 15, 2009, https://doi.org/10.1021/cr900263j
- Fan, Yong & Zhang, Fan. (2019). A New Generation of NIR‐II Probes: Lanthanide‐Based Nanocrystals for Bioimaging and Biosensing. Advanced Optical Materials. 10.1002/adom.201801417.
- Bashkatov, A.N., Genina, E.A., Kozintseva, M.D., Kochubei, V.I., Gorodkov, S. Yu., and Tuchin, V.V. Optical properties of peritoneal biological tissues in the spectral range of 350-2500 nm. Optics and Spectroscopy,120, 1-8, 2016.
- Zhu, S. Kwon, J. C. Rasmussen, M. Litorja and E. M. Sevick-Muraca, “Comparison of NIR Versus SWIR Fluorescence Image Device Performance Using Working Standards Calibrated With SI Units,” in IEEE Transactions on Medical Imaging, vol. 39, no. 4, pp. 944-951, April 2020, doi: 10.1109/TMI.2019.2937760.
- Remi, Sebastian., Laser Focus World Article, 28/01/2020, https://www.laserfocusworld.com/test-measurement/spectroscopy/article/14074088/superdeepdepletion-ccds-optimize-bioraman-spectroscopy?utm_source=LFW+Test+%26+Measurement&utm_medium=email&utm_campaign=CPS200520051& amp;o_eid=4103H7594489B5Y&rdx.ident%5Bpull%5D=omeda%7C4103H7594489B5Y&oly_enc_id=4103H7594489B5Y
Further Reading
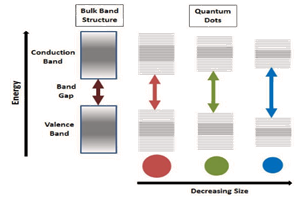
NIR-II Probes for In vivo Imaging
Overview of the most common NIR-II probes currently used within in vitro, ex vivo and in vivo studies, including quantum dots, single-walled carbon nanotubes and rare earth nanoparticles.

InGaAs Cameras for Drug Discovery and Small Animal Research
Brief overview of how the SWIR wavelength range can be utilized for small animal imaging and drug discovery.
Carbon Nanotube Sensors for Early Disease Detection
Overview of the development of novel nanomaterials which make it easier to identify disease biomarkers within the body.