
Introduction
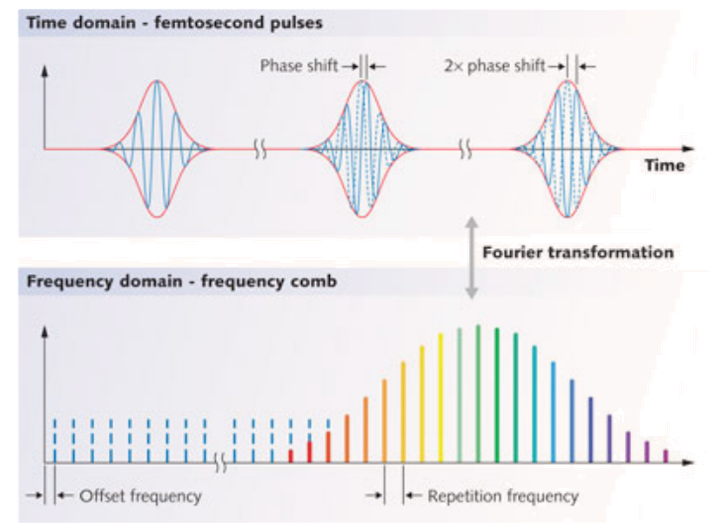
A frequency comb is a spectrum that comprises a series of discrete, equally spaced elements. The most popular mechanism used to generate a frequency comb is stabilization of the pulse train by a mode-locked laser. In 2005, John L. Hall and Theodor W. Hänsch shared one half of the Nobel Prize in Physics for their contributions to this important area. Recently developed techniques based on femtosecond frequency combs (see Figure 1) can be utilized in a wide range of advanced measurement applications, including high-precision spectroscopy, atomic clocks, chemical sensors, super lasers, long-distance communications, and LIDAR.
Researchers at Texas A&M University, led by Prof. Hans A. Schuessler, recently employed a scientific InGaAs camera from Princeton Instruments to perform femtosecond frequency comb vernier spectroscopy in the near infrared via a simple experimental setup1. Their innovative work, which has broad applications for sensing greenhouse gases in the fingerprint NIR region, is the focus of this application note.
Basics
Femtosecond frequency combs provide a regular comb structure consisting of millions of simultaneously accessible narrow-linewidth laser modes2. Over the past decade, a number of methods have used this broad-spectral-bandwidth and high-resolution comb structure for spectroscopy ranging from the extreme ultraviolet to the terahertz region1.
The principle of frequency comb vernier spectroscopy was first introduced in 2007 by C. Gohle et al.3 and is briefly outlined below 1. The cavity length L is intentionally adjusted to make the cavity free spectral range (FSR=c/(2nL)) mismatch the repetition rate fr of the frequency comb, so that only every mth comb mode is on resonance with every (m-1)th mode of the cavity, and the modes of the original frequency comb and the resonant frequencies of the cavity resemble a vernier with a ratio of FSR/fr=m/(m-1).
Figure 2 shows the case of FSR/fr=10/9. If the finesse of the cavity is high enough, the other off-resonance comb modes will be strongly suppressed, which results in an effective spectral filter for the original comb. The frequency comb filtered by the cavity has a mode spacing of mfr , thus for a large number m, it can be resolved with a simple grating-based spectrograph1.

Experimental Setup
The Texas A&M experimental setup is depicted in Figure 3. A femtosecond Er-fiber laser was used as a frequency comb source and a Princeton Instruments NIRvana:640 scientific InGaAs camera was employed for detection. After the mode matching lenses, the frequency comb was coupled into a scanning high-finesse Fabry-Perot cavity consisting of a flat mirror and a 2 m radius concave mirror. A 50 mm x 50 mm, 300 grooves/mm gold-coated grating was utilized in a 300 mm focal length Czerny-Turner spectrometer. A tilting mirror driven by a galvo, which was synchronized with the scanning cavity, was used to map different groups of filtered combs onto one spatial dimension of the InGaAs camera’s sensor1.
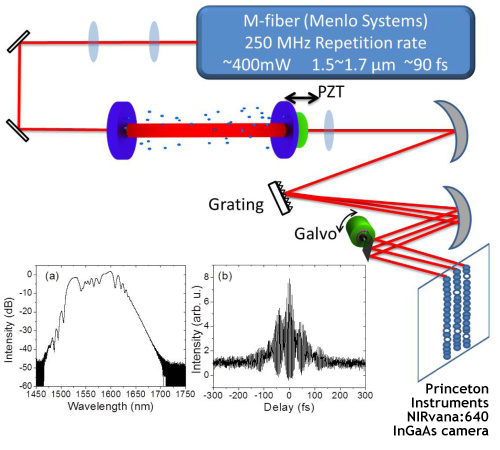
The NIRvana:640 features a two-dimensional 640 x 512 InGaAs focal plane array (FPA) with a pixel size of 20 μm x 20 μm. The exposure time of the camera was synchronized with the PZT scanning and galvo tilting to record one single-scan image. To reduce system noise attributable to dark current, the FPA was thermoelectrically cooled to −80°C. Acetylene was chosen as a sample because it has an absorption band between 1510 nm and 1550 nm, which lies within the sensitivity range of the InGaAs camera1.
Results and Discussion
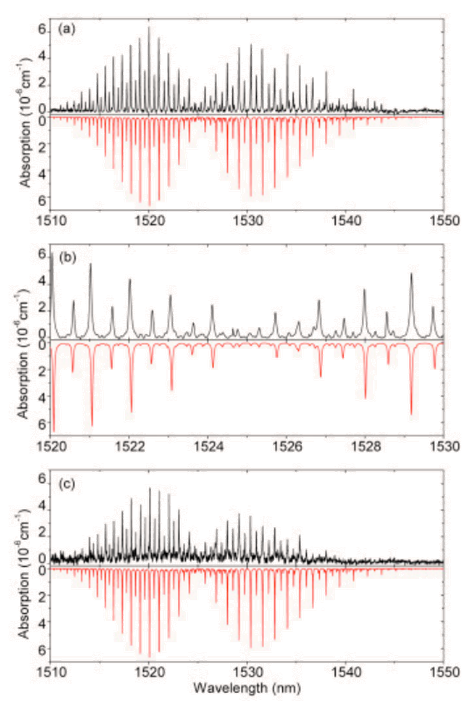
The cavity was first filled with a mixture of 5 ppmv acetylene and air at room temperature and atmospheric pressure to take the sample image. Compressed air was then used to purge the cavity, allowing the researchers to acquire the reference image under the same conditions. Images with a 500 msec scan time displayed good intensity contrast. By tuning the cavity length L, the vernier ratio could be changed1.
For the vernier ratio of 500/499, the filtered comb spacing was 125 GHz, and the resolution under these conditions was 1.1 GHz, corresponding to about to 5 comb modes. For the vernier ratio of 250/249, the resolution was 550 MHz, corresponding to about 2 to 3 comb modes.
Figure 4 presents the absorption spectrum retrieved from the images. Provided a higher-resolution spectrometer with a larger grating and a spot size better matching the FPA pixel size, it seems possible to resolve the single frequency comb modes of a few hundreds MHz spacing with the future development of cameras1.
For more complete data and a comprehensive discussion of this work, please refer to F. Zhu et al., “Near infrared frequency comb vernier spectrometer for broadband trace gas detection,” Optics Express 22(19) 23026–23033 (2014).
Enabling Technology
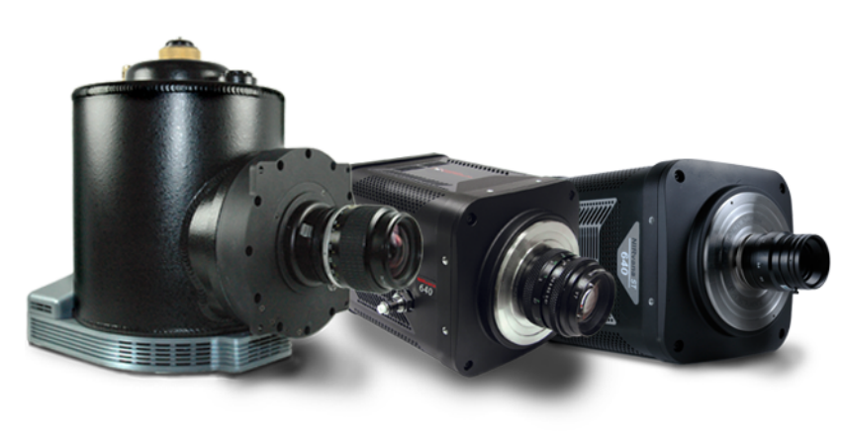
The NIRvana® family of InGaAs cameras from Princeton Instruments (see Figure 5) differentiates itself from other InGaAs cameras via a number of scientific performance features, including deep cooling, low dark noise, high linearity, low read noise, high frame rates, intelligent software, and precision control over integration times.
It should also be noted that while the Texas A&M experimental setup employed a home-built spectrometer, the ready-to-use, state-of-the-art Princeton Instruments IsoPlane® SCT-320 spectrometer is particularly well suited for performing leading-edge applications such as femtosecond frequency comb vernier spectroscopy in the near-infrared range. The patented design of the IsoPlane SCT-320 eliminates field astigmatism and greatly reduces coma, enabling crisp, detailed imaging across a 27 x 8 mm focal plane.
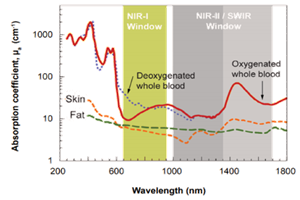
NIRvana InGaAs cameras, in addition to being utilized as part of the experimental setup at Texas A&M, are being used for many other NIR-II / SWIR applications, including semiconductor failure analysis, solar cell inspection, nondestructive testing, astronomy, small-animal imaging, and singlet oxygen detection4-7.
Resources
To learn more about studies conducted by Dr. Schuessler’s research group at Texas A&M, please visit: http://sibor.physics.tamu.edu/group/has/
Acknowledgments
Princeton Instruments would like to thank Prof. Hans A. Schuessler, Texas A&M University, for his invaluable contributions to this application note.
References
- Zhu, J. Bounds, A. Bicer, J. Strohaber, A.A. Kolomenskii, C. Gohle, M. Amani, and H.A. Schuessler, “Near infrared frequency comb vernier spectrometer for broadband trace gas detection,” Optics Express 22(19) 23026–23033 (2014). doi: 10.1364/OE.22.023026 Open Access: https://www.osapublishing.org/oe/fulltext.cfm?uri=oe-22-19-23026&id=301333
- Udem, R. Holzwarth, and T.W. Hänsch, “Optical frequency metrology,” Nature 416(6877), 233–237 (2002).
- Gohle, B. Stein, A. Schliesser, Th. Udem, and T.W. Hänsch, “Frequency comb vernier spectroscopy for broadband, high-resolution, high-sensitivity absorption and dispersion spectra,” Phys. Rev. Lett. 99(26), 263902 (2007).
- “Scientific NIR-II / SWIR cameras for advanced imaging and spectroscopy applications,” Princeton Instruments application note (2015).
- “Solar cell inspection via photoluminescence imaging in the NIR / SWIR,” Princeton Instruments application note (2012).
- “Deeply cooled, scientific InGaAs cameras facilitate NIR-II / SWIR imaging for drug discovery / small-animal research,” Princeton Instruments application note (2014).
- “Real-time imaging of singlet oxygen via innovative microspectroscopy instrument,” Princeton Instruments application note (2014).
Further Reading
Scientific SWIR Cameras for Advanced Imaging and Spectroscopy Applications
A brief overview of some advanced applications which utilize the SWIR wavelength range.
Introduction to Scientific InGaAs FPA camera
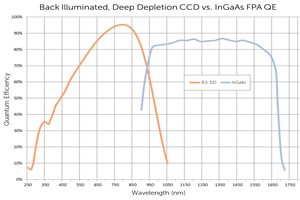
Technical note describing the composition of InGaAs cameras, how they compare to silicon-based CCDs, InGaAs limitations and InGaAs advantages.
NIR-II Probes for In vivo Imaging
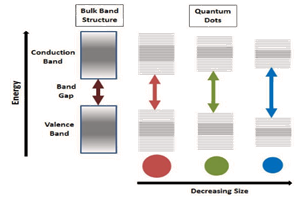
Overview of the most common NIR-II probes currently used within in vitro, ex vivo and in vivo studies, including quantum dots, single-walled carbon nanotubes and rare earth nanoparticles.