
Introduction
Over the past several years, biomedical researchers and engineers working in labs, hospitals, and universities around the world have developed an extensive set of spectroscopy-based methods — including a new class of non-invasive in vivo techniques utilizing near-infrared spectroscopy (NIRS) — to facilitate the rapid and accurate detection and diagnosis of disease and injury.1
Recently, a British research group affiliated with both the Department of Medical Physics and Bioengineering, University College London, as well as the Institute for Women’s Health, University College London and Neonatal Unit, University College London Hospitals Trust, designed and tested a NIRS system to aid in the diagnosis of neonatal brain injury.2
The novel bedside system built by the researchers in London simultaneously measures cerebral changes in tissue oxygenation and hemodynamics by estimating the changes in hemoglobin concentration. The portable system also tracks oxygen utilization by measuring the oxidation state of cytochrome-c-oxidase (CCO), which is responsible for >95% of oxygen metabolism in the body.2
Use of the London team’s lens-based broadband NIRS system, known as CYRIL (short for “CYtochrome Research Instrument and AppLication”), was demonstrated in a cohort of six newborn infants with neonatal encephalopathy in the Neonatal Intensive Care Unit (NICU) for continuous measurement periods of up to five days; the NIRS measurements commenced immediately after being granted parental consent.2*
CYRIL Setup
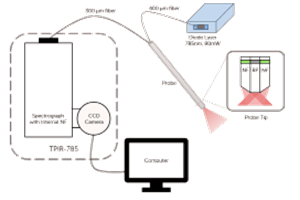
The CYRIL system (see Figure 1) utilizes two discrete channels, each employing a single light source with four detectors. An optical fiber illuminator with a thermally stable broadband white light source is used for each channel and an aspheric lens collimates the lamp’s high-intensity NIR output, focusing it onto the fiber input. A shutter and iris control the amount of light entering the fiber. Use of a long-pass (610 nm) and a short-pass (950 nm) filter in the collimated region narrows the spectrum to the detected wavelengths.2
*Ethical approval for the Baby Brain Study at University College London Hospitals Trust (UCLH) was obtained from the North West Research Ethics Centre (REC reference: 13/LO/0106). Term infants born at or transferred to UCLH for treatment of acute brain injury were eligible for investigation; only babies without congenital malformations and considered likely to survive were considered.2
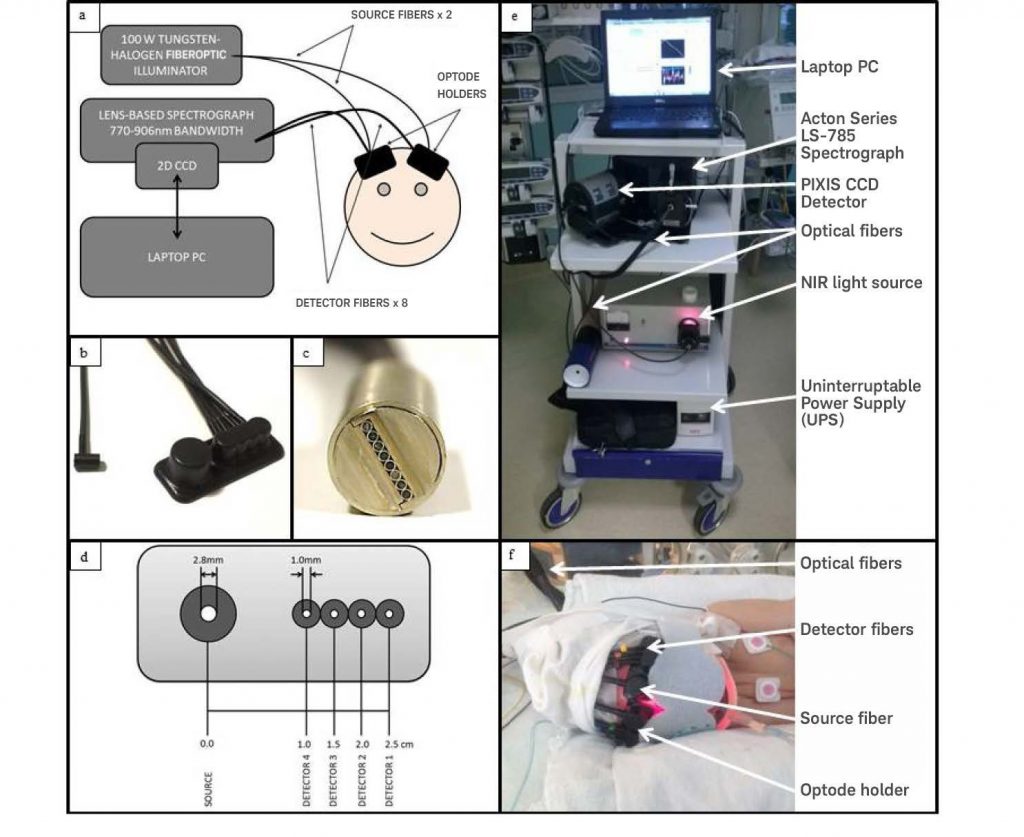
Optical fibers and optode holders connect the light source to the tissue, as well as the tissue to the spectrograph. Each 3 meter fiber bundle consists of multiple high–numerical-aperture fibers (NA = 0.57) with 30 μm diameters. At the tissue, the source fiber bundle branches into a pair of fiber heads (bundle diameter = 2.8 mm). The detectors, meanwhile, comprise eight individual fiber bundles (diameter = 1 mm). The detector fibers can be arranged in any combination, thus enabling multi-distance measurements, spatially resolved spectroscopy (SRS), and/or image acquisition. The fibers are arranged vertically into a ferrule that inputs the light to the spectrometer, which allows the spectrum from each fiber to be detected on a two-dimensional CCD individually as well as simultaneously.2
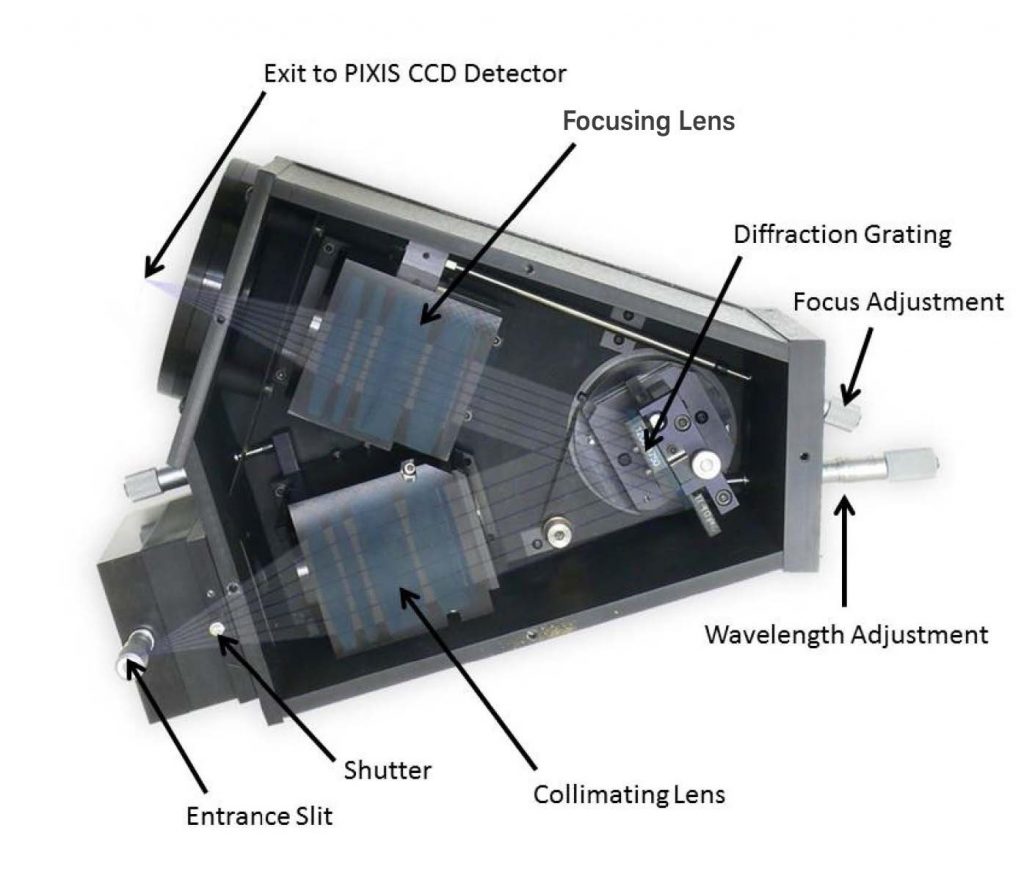
As the light throughput of lens-based spectrographs is superior (>99%) to that of mirror-based spectrographs, the CYRIL system utilizes an Acton Series LS-785 lens-based spectrograph from Teledyne Princeton Instruments (see Figure 2). After light is collected from the tissue surface by CYRIL’s detector fibers, it is input into a fiber-adapted entrance in the LS-785 and passes through a variable slit to prevent overexposure. The optimal slit opening in this study was determined to be 20 μm. To reduce loss, the light is collimated and then guided to a diffraction grating (blazed at 1000 nm; 830 grooves per mm) that yields a wavelength resolution of 0.7 nm and a bandwidth of 136 nm. Because the diffraction grating is mounted on a rotating platform within the LS-785, it is easy for CYRIL users to select the range of wavelengths to be resolved (770 – 906 nm in this study). Lastly, the light is focused onto the CCD via an f/2 focusing lens. Focusing the light in the y-direction reduces cross-talk between detector channels.2
The CCD, a scientific-grade sensor utilized by the CYRIL system’s Teledyne Princeton Instruments PIXIS:512F camera, features a photosensitive array whose peak quantum efficiency is in the NIR region. This two-dimensional array of 512 x 512 pixels measures 12.3 x 12.3 mm, with each pixel measuring 24 x 24 μm. Light from all eight of CYRIL’s detector fibers can be detected simultaneously on the sensor, whose front-illuminated architecture is ideal for the low to moderate photonic signal levels associated with near-infrared spectroscopy. To reduce dark noise, the CCD is thermoelectrically cooled to –70°C (thermally stable to ± 0.05°C) during camera operation; the dark current at this temperature is 0.002 electrons/pixel/sec. When the camera is run at 1000 kHz, the read noise is 5 electrons RMS. The researchers used Teledyne Princeton Instruments LightField® acquisition software (in concert with the IntelliCal® calibration package) to calibrate each pixel in the x-direction to its corresponding wavelength bin. After calibration, the CCD resolution is 0.27 nm. Therefore, CYRIL’s wavelength resolution is 0.27 ± 0.70 nm.2
Data Acquisition and Analysis
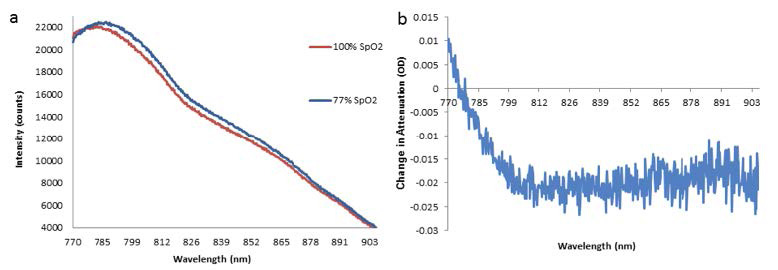
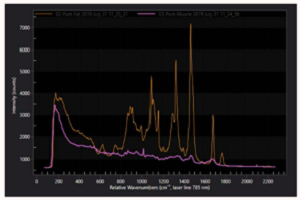
Examples of the intensity spectra recorded (Figure 3a) and the corresponding change in attenuation between them (Figure 3b) are presented below. The change in the tissue’s levels of hemoglobin chromophore concentration is reflected by the intensity spectrum’s change in shape. During systemic oxygen desaturation (SpO2), the peak of the spectra shifts from ~780 nm to ~785 nm due to the decrease in Δ[oxCCO] (i.e., the oxidation state of the metabolic enzyme cytochrome-c-oxidase) and Δ[chromophore HbO2], as well as the increase in Δ[chromophore HHb].2
National Instruments’ LabVIEW® 2011 software was utilized to create the custom program that allows CYRIL users to control the PIXIS:512F, collect raw data, and calculate the corresponding concentrations. The special LabVIEW program offers real-time views of the detected intensity spectra and concentration changes of the chromophores for each channel, right at the bedside. Its wavelength binning functionality lets CYRIL system users acquire and display an intensity-weighted image of the CCD’s 512 x 512 array and select the region of interest (ROI) for each individual horizontal strip to bin. Each strip corresponds to one of the detector fibers input into the LS-785 spectrometer. All of the strips can be adjusted to maximize intensity spectra per channel without saturation and to minimize cross-talk between channels. The London researchers report no significant cross-talk in the study’s setup.2
LabVIEW drivers from R Cubed Software’s scientific imaging tool kit enable the PIXIS:512F to acquire data separately from the ROIs and to bin the data by wavelength per user-defined settings. Recorded light intensities peaked at >60000 counts/sec in the study. Typical photon counts were >50000 for the detectors placed 1 cm from the source, >35000 for detectors 1.5 cm from the source, >30000 for detectors 2.0 cm from the source, and >24000 for detectors 2.5 cm from the source. The dark count was 2 orders of magnitude lower (~400 counts). Mathworks’ MATLAB® software was used to perform data analysis and the NIRS data were processed with an automatic wavelet de-noising function capable of reducing high-frequency noise whilst maintaining trend information.2
Summary of Results
The researchers utilized CYRIL both to measure changes in cerebral tissue oxygenation simultaneously with hemodynamics by estimating changes in hemoglobin concentrations as well as to track metabolism and oxygen utilization by measuring the oxidation state of CCO. Quantitative near-infrared spectroscopy data were acquired at the same time as systemic data, permitting multimodal data analysis, and the researchers studied NIRS variables in response to global pathophysiological events (NIRS analysis was focused on spontaneous oxygen desaturations). The study indicates that the relationship between hemoglobin oxygenation changes and CCO oxidation changes during the desaturation events was significantly correlated with a magnetic-resonance-spectroscopy–measured biomarker of injury severity.2
Enabling Technologies
CYRIL’s Acton Series LS-785 from Teledyne Princeton Instruments is a lens-based spectrograph (see Figure 4) that delivers the highest throughput of any commercially available NIR Raman spectrometer on the market today. Performance advantages of the LS-785 include easy wavelength adjustment for 750 – 830 nm laser excitations, custom-designed anti-reflective coatings, unique f/2 lenses (whose proprietary coatings provide >99% throughput), simple interfacing to fiberoptic probes and microscopes, and 5 cm.-1 resolution.

CYRIL also employs a Teledyne Princeton Instruments PIXIS:512F scientific CCD camera. This low-noise camera, which has been engineered for optimal performance in quantitative UV-to-NIR imaging and spectroscopy applications, uses Teledyne Princeton Instruments’ exclusive XP cooling technology to minimize thermally generated dark current (thereby preserving high signal-to-noise ratios even during many hours of continuous operation). Thanks to this innovative and field-proven technology, PIXIS is the only scientific camera platform to offer deep cooling with an all-metal, hermetically sealed design that carries a lifetime vacuum guarantee. For convenient control and image/spectra acquisition using a laptop, the PIXIS:512F is equipped with a USB 2.0 data interface.
Both the LS-785 lens-based spectrograph and the PIXIS:512F scientific CCD camera are fully compatible with Teledyne Princeton Instruments’ 64-bit LightField imaging and spectroscopy software (see Figure 5). LightField serves as a full-feature “command center” — affording users complete control of spectrometer and camera operating parameters, spectral acquisition, data processing, and more. Among its many benefits, such as a powerful new math engine, LightField allows direct data acquisition into National Instruments’ LabVIEW and MathWorks’MATLAB software packages.

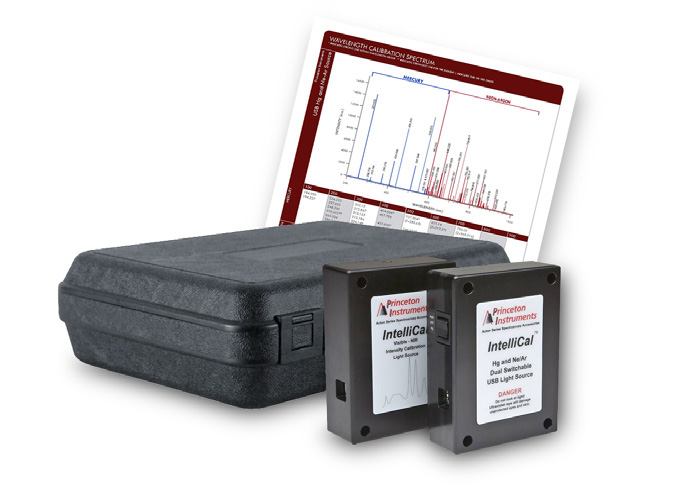
Furthermore, LightField supports Teledyne Princeton Instruments’ exclusive IntelliCal wavelength and intensity calibration package (see Figure 6). Yet another capability leveraged to good effect by the creators of CYRIL, IntelliCal provides up to 10x improvement in wavelength accuracy and instrument-independent intensity calibration.
Future Directions
By providing unique and real-time in vivo patient data, new bedside spectroscopy-based measurement systems such as CYRIL hold the potential not only to aid in disease and injury diagnosis but to help guide treatment.
In the coming years, commercially available high-precision spectrometers and scientific cameras like those from Teledyne Princeton Instruments will continue to offer biomedical researchers and engineers a broad range of easy-to-integrate features and functions to meet the evolving sensitivity, speed, and resolution requirements of these novel systems.
Resources
To learn more about the latest NIRS-enabled research being performed by the Multimodal Spectroscopy group at University College London, please visit: www.ucl.ac.uk/medphys/research/borl/nirs/mms
References
- Vargis E. and Mahadevan-Jansen A. Using Raman spectroscopy to detect malignant changes in tissues. Teledyne Princeton Instruments Application Note (2011).
- Bale G., Mitra S., Meek J., Robertson N., and Tachtsidis I. A new broadband near-infrared spectroscopy system for in-vivo measurements of cerebral cytochrome-c-oxidase changes in neonatal brain injury. Biomedical Optics Express 5(10), 3450–3466 (2014). DOI:10.1364/BOE.5.003450 Open access: https://www.osapublishing.org/boe/abstract.cfm?URI=boe-5-10-3450
Acknowledgment
Teledyne Princeton Instruments would like to thank Dr. Ilias Tachtsidis, University College London, for his invaluable contributions to this application note.
Further Reading
Raman Spectroscopy in Life Sciences
Brief overview of how Raman spectroscopy is advantageous for life science applications, such as characterizing biomolecules and for biosensing.
Ultra-Multiplex CARS Spectroscopic Imaging of Living Cells
Ultra-multiplex CARS spectroscopic imaging is able to provide non-invasive, real-time, cellular-level molecular diagnostics for both experimental and clinical applications.
Using Raman Spectroscopy to Detect Malignant Changes in Tissues
Summary of the work done at Vanderbilt University, in which a Raman spectroscopy system was used to non-invasively detected malignant tissue