
Wavelength calibration
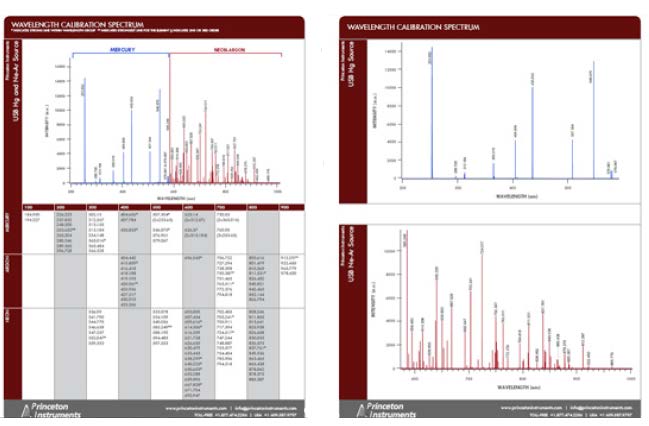
Calibration of dispersive spectral instruments has long been problematic for researchers. When a spectrum is plotted along a pair of axes, the x-axis usually represents wavelength or wavenumbers, while the y-axis represents intensity. Optical spectroscopic equipment manufacturers have all but left the task of determining the accuracy of both scales to the user. Typically, one calibrates the x-axis by measuring the positions of two or more mercury emission lines and interpolating between them. The accuracy with which intermediate wavelengths are known is (1) not specified, (2) only as good as the interpolation routine, and (3) generally much worse than the user expects.
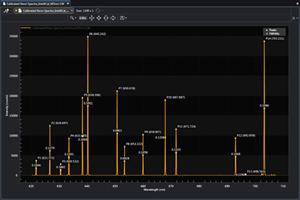
In 2010, Princeton Instruments introduced 64-bit LightField™ data acquisition software featuring IntelliCal™, a patent-pending wavelength calibration routine based on the Rietveld refinement algorithm utilized in x-ray spectroscopy. Using an emission line source and a table of lines from the NIST spectral database, IntelliCal solves for the wavelength of each pixel simultaneously across the entire focal plane of a 26 mm CCD mounted on a dispersive spectrograph.
The wavelength accuracy of the calibration at each pixel is stored with the spectral data file, thus ensuring reliable data validation and traceability. Comparing the results to a table of emission lines (see Figure 1) shows that accuracy of the IntelliCal wavelength calibration routine is typically 4x to 10x better than that of a conventional interpolative method.
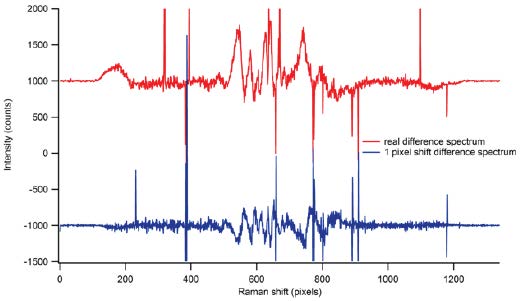
Wavelength inaccuracy is far from a trivial problem. Many spectroscopic experiments require the use of difference spectra, where an experimental spectrum is subtracted from a standard. A wavelength shift by just a single pixel (i.e., the limit of resolution) in a Raman spectrum will render the difference spectrum unrecognizable. This often necessitates that the instrument be recalibrated and the entire experiment repeated.
Figure 2 shows a true difference Raman spectrum (displayed in red) and a spurious difference spectrum obtained from a shift of a single pixel (displayed in blue). There is no obvious way to tell which is the correct spectrum. The better and easier the calibration routine, the smaller the chance that one will have to repeat measurements or, worse yet, publish spurious data.
Other areas in which wavelength accuracy is critical include process analytical, forensic, and hazmat identification, where a spectral fingerprint serves to identify the unknown material. Search-match algorithms compare a measured spectrum to spectral libraries using pattern recognition routines. Accurate knowledge of the Raman shift of a given band, or the precise emission wavelength of a line in a LIBS spectrum, ensures the success of the match, while inaccurate spectra increase the risk of both false positives and negatives.
Intensity calibration fundamentals
Intensity calibration is even more challenging. The data recorded by a spectrometer is never the true spectrum; rather, it is modified by every optical element along the light path, including lenses, mirrors, the diffraction grating, and the detector. Each of these elements has its own spectral response. Figure 3 shows the responses of a typical holographic diffraction grating (green curve) and a back-thinned CCD camera (black curve). A spectrum recorded with these components will include their instrumental artifacts. Researchers know that spectra should be normalized to remove the instrumental contribution, but because this process is tedious and difficult, it is rarely done. Choquette has outlined the technique in Applied Spectroscopy (2007, 61: 117).
Typical instrumental intensity artifacts are shown in Figure 4. These spectra show photoluminescence from zinc oxide recorded on a high-resolution spectrometer. The red curve is the true spectrum; the blue and green curves show spurious peaks arising from discontinuous changes in grating diffraction efficiency as the grating is rotated around its axis (i.e., as the wavelength is scanned across the focal plane).
The spectra presented in Figure 5 are of an incandescent lamp. The black curve shows the theoretical blackbody spectrum; the three colored curves show the measured data, with a sharp feature that arises from a Wood’s anomaly.
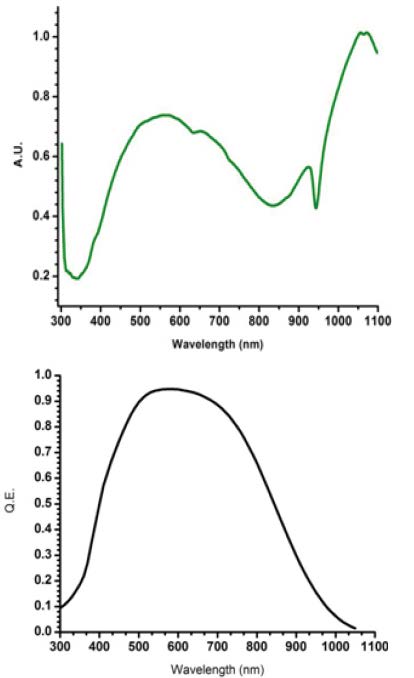
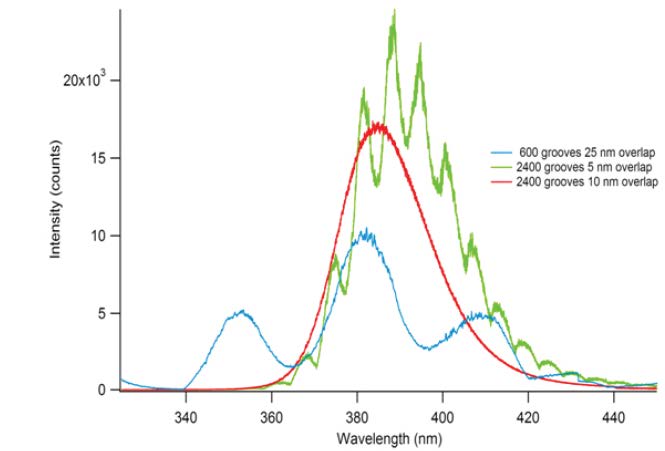
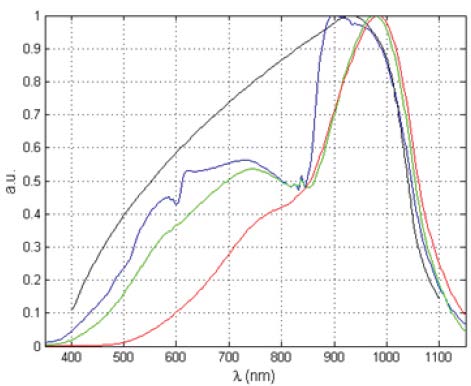
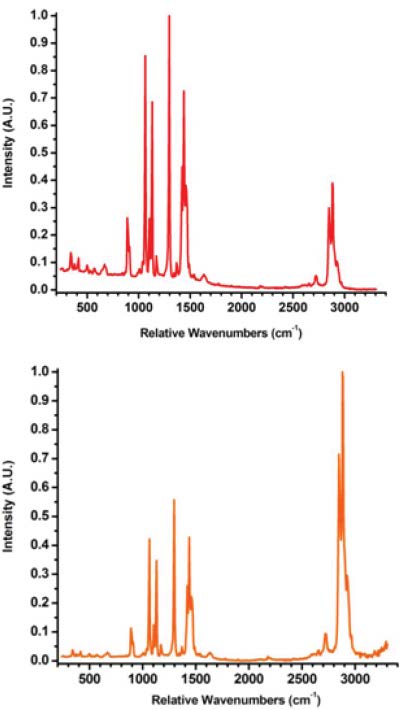
Figure 6 shows Raman spectra of stearic acid, a common component of pharmaceutical tablets. The spectrum rendered in red represents raw data, while the spectrum rendered in orange has been corrected. The excitation wavelength is 785 nm; the C-H stretching peaks at 2900 cm-1 are at 1015 nm, where the detector’s quantum efficiency is rapidly decreasing to zero. Intensity calibration restores the proper peak-height ratio while flattening the baseline, making it much easier to quantify the fraction of stearic acid in a mixture.
Intensity calibration via IntelliCal
In 2011, Princeton Instruments released LightField 4.0, a major update to the innovative data acquisition package, with new support for PI-MAX® 3 intensified CCD cameras. Also released was IntelliCal 2.0, which includes both the fully automated wavelength and intensity calibration routines. The intensity calibration engine is a USB-powered, multi-LED light source with emission from 400 to 1100 nm. Each highly stable source is individually calibrated against a standard and the spectrum is recorded in the device’s firmware.
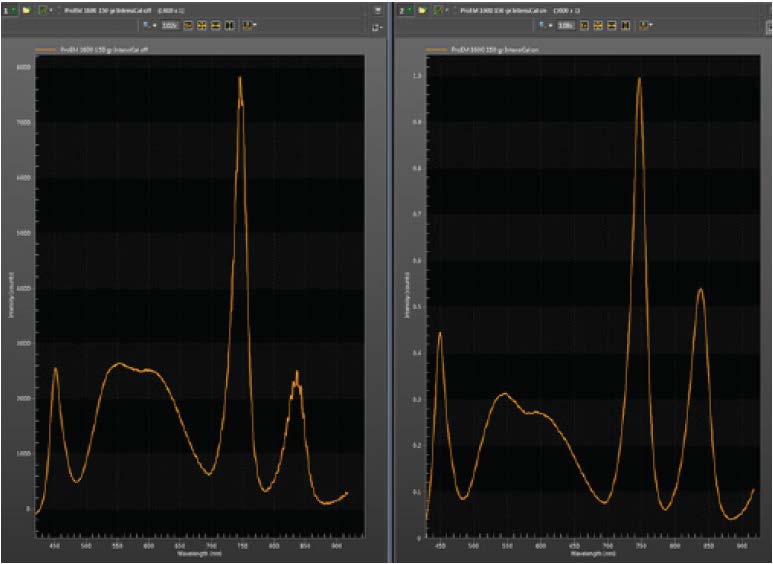
To calibrate a spectrometer, the researcher illuminates the entrance slit with the IntensiCal™ source and records the spectrum (as seen in Figure 7). The uncorrected spectrum displayed in Figure 7 shows a spectral stitching artifact at 610 nm and substantial etaloning at 830 nm that arises from interference fringes on the back-illuminated sensor used to collect the data.
In the corrected spectrum (Figure 7), the stitching and etaloning artifacts are gone. The relative peak heights have also been corrected. For this particular example, the IntensiCal light source was utilized to correct its own spectrum, but the routine is entirely general. A Raman, photoluminescence, fluorescence, absorption, or LIBS spectrum can be corrected as easily as that of the light source itself.
Summary
Princeton Instruments has once again elevated the science of dispersive spectral instrumentation by adding unprecedented usability to the list of key performance criteria. Instead of wasting valuable laboratory time developing their own correction routines, spectroscopists can now use automated IntelliCal to gain 100% confidence in both axes of their recorded spectra.
Further Reading
Fully automated wavelength calibration for data accuracy
Article describing how IntelliCal’s full-spectrum calibration routine can greatly enhance spectral accuracy.
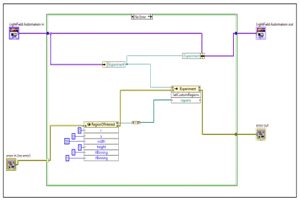
Instrument Automation via National Instruments LabVIEW
A step-by-step guide into automating a custom region of interest to showcase how to automate using LabVIEW.
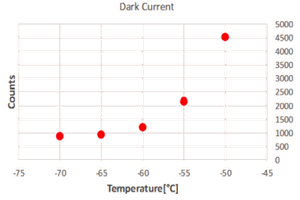
Automating Acquisition with MATLAB During Temperature Changes
A guide on how to automate data acquisition in respect to changing camera temperature using MATLAB software.